1990 Gubernatorial General Election Data Graphs - Minnesota
Note: The Google advertisement links below may advocate political positions that this site does not endorse.
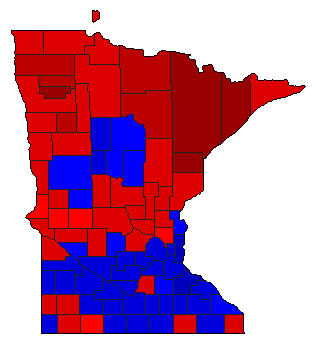
Map

AitkinPerpich52.4%
 
Carlson43.3%
 
0.0%
 
Other4.3%


AnokaPerpich49.8%
 
Carlson47.6%
 
0.0%
 
Other2.6%


BeckerPerpich50.5%
 
Carlson46.3%
 
0.0%
 
Other3.1%


BeltramiPerpich50.4%
 
Carlson45.4%
 
0.0%
 
Other4.2%


BentonPerpich50.9%
 
Carlson44.5%
 
0.0%
 
Other4.5%


Big StonePerpich55.0%
 
Carlson41.8%
 
0.0%
 
Other3.2%


Blue EarthPerpich42.5%
 
Carlson54.0%
 
0.0%
 
Other3.5%


BrownPerpich42.0%
 
Carlson54.9%
 
0.0%
 
Other3.1%


CarltonPerpich73.6%
 
Carlson23.9%
 
0.0%
 
Other2.5%


CarverPerpich39.6%
 
Carlson57.6%
 
0.0%
 
Other2.7%


CassPerpich46.0%
 
Carlson49.2%
 
0.0%
 
Other4.7%


ChippewaPerpich47.3%
 
Carlson49.9%
 
0.0%
 
Other2.8%


ChisagoPerpich48.3%
 
Carlson48.8%
 
0.0%
 
Other3.0%


ClayPerpich54.4%
 
Carlson43.3%
 
0.0%
 
Other2.2%


ClearwaterPerpich57.4%
 
Carlson39.3%
 
0.0%
 
Other3.3%


CookPerpich51.9%
 
Carlson41.6%
 
0.0%
 
Other6.5%


CottonwoodPerpich42.6%
 
Carlson55.0%
 
0.0%
 
Other2.4%


Crow WingPerpich46.1%
 
Carlson49.2%
 
0.0%
 
Other4.7%


DakotaPerpich40.1%
 
Carlson57.5%
 
0.0%
 
Other2.4%


DodgePerpich42.8%
 
Carlson54.0%
 
0.0%
 
Other3.2%


DouglasPerpich48.0%
 
Carlson48.8%
 
0.0%
 
Other3.1%


FaribaultPerpich41.0%
 
Carlson56.1%
 
0.0%
 
Other2.9%


FillmorePerpich40.5%
 
Carlson57.1%
 
0.0%
 
Other2.4%


FreebornPerpich47.7%
 
Carlson50.4%
 
0.0%
 
Other1.9%


GoodhuePerpich36.4%
 
Carlson61.6%
 
0.0%
 
Other1.9%


GrantPerpich52.7%
 
Carlson44.8%
 
0.0%
 
Other2.5%


HennepinPerpich42.0%
 
Carlson54.5%
 
0.0%
 
Other3.4%


HoustonPerpich51.4%
 
Carlson45.8%
 
0.0%
 
Other2.8%


HubbardPerpich43.9%
 
Carlson52.2%
 
0.0%
 
Other3.9%


IsantiPerpich56.8%
 
Carlson40.2%
 
0.0%
 
Other3.0%


ItascaPerpich67.5%
 
Carlson28.5%
 
0.0%
 
Other4.0%


JacksonPerpich49.6%
 
Carlson46.9%
 
0.0%
 
Other3.5%


KanabecPerpich53.7%
 
Carlson42.9%
 
0.0%
 
Other3.4%


KandiyohiPerpich52.4%
 
Carlson45.3%
 
0.0%
 
Other2.3%


KittsonPerpich56.1%
 
Carlson41.5%
 
0.0%
 
Other2.5%


KoochichingPerpich60.2%
 
Carlson36.7%
 
0.0%
 
Other3.0%


Lac Qui ParlePerpich52.0%
 
Carlson45.3%
 
0.0%
 
Other2.7%


LakePerpich74.4%
 
Carlson21.7%
 
0.0%
 
Other3.9%


Lake of the WoodsPerpich58.9%
 
Carlson36.5%
 
0.0%
 
Other4.7%


Le SueurPerpich50.7%
 
Carlson46.5%
 
0.0%
 
Other2.8%


LincolnPerpich47.4%
 
Carlson51.0%
 
0.0%
 
Other1.7%


LyonPerpich40.7%
 
Carlson56.7%
 
0.0%
 
Other2.6%


McLeodPerpich41.4%
 
Carlson55.9%
 
0.0%
 
Other2.7%


MahnomenPerpich64.9%
 
Carlson29.9%
 
0.0%
 
Other5.2%


MarshallPerpich62.8%
 
Carlson35.2%
 
0.0%
 
Other2.0%


MartinPerpich38.1%
 
Carlson59.6%
 
0.0%
 
Other2.3%


MeekerPerpich46.7%
 
Carlson49.9%
 
0.0%
 
Other3.4%


Mille LacsPerpich53.5%
 
Carlson42.2%
 
0.0%
 
Other4.3%


MorrisonPerpich57.0%
 
Carlson39.3%
 
0.0%
 
Other3.7%


MowerPerpich53.2%
 
Carlson44.0%
 
0.0%
 
Other2.8%


MurrayPerpich52.8%
 
Carlson44.4%
 
0.0%
 
Other2.8%


NicolletPerpich39.9%
 
Carlson57.4%
 
0.0%
 
Other2.7%


NoblesPerpich56.9%
 
Carlson40.1%
 
0.0%
 
Other3.0%


NormanPerpich58.7%
 
Carlson38.5%
 
0.0%
 
Other2.8%


OlmstedPerpich39.2%
 
Carlson58.4%
 
0.0%
 
Other2.4%


Otter TailPerpich47.9%
 
Carlson49.0%
 
0.0%
 
Other3.1%


PenningtonPerpich61.4%
 
Carlson36.5%
 
0.0%
 
Other2.1%


PinePerpich59.4%
 
Carlson35.8%
 
0.0%
 
Other4.8%


PipestonePerpich51.8%
 
Carlson45.6%
 
0.0%
 
Other2.6%


PolkPerpich58.8%
 
Carlson39.0%
 
0.0%
 
Other2.2%


PopePerpich49.7%
 
Carlson47.7%
 
0.0%
 
Other2.6%


RamseyPerpich42.4%
 
Carlson54.3%
 
0.0%
 
Other3.3%


Red LakePerpich71.0%
 
Carlson25.2%
 
0.0%
 
Other3.8%


RedwoodPerpich38.2%
 
Carlson58.2%
 
0.0%
 
Other3.5%


RenvillePerpich43.2%
 
Carlson53.8%
 
0.0%
 
Other3.0%


RicePerpich46.6%
 
Carlson49.9%
 
0.0%
 
Other3.5%


RockPerpich48.2%
 
Carlson50.0%
 
0.0%
 
Other1.7%


RoseauPerpich59.1%
 
Carlson37.5%
 
0.0%
 
Other3.4%


St. LouisPerpich73.6%
 
Carlson23.7%
 
0.0%
 
Other2.7%


ScottPerpich46.6%
 
Carlson50.9%
 
0.0%
 
Other2.5%


SherburnePerpich50.1%
 
Carlson46.3%
 
0.0%
 
Other3.6%


SibleyPerpich39.9%
 
Carlson57.6%
 
0.0%
 
Other2.6%


StearnsPerpich50.6%
 
Carlson45.2%
 
0.0%
 
Other4.2%


SteelePerpich42.1%
 
Carlson55.6%
 
0.0%
 
Other2.3%


StevensPerpich49.9%
 
Carlson47.2%
 
0.0%
 
Other2.9%


SwiftPerpich57.8%
 
Carlson39.2%
 
0.0%
 
Other2.9%


ToddPerpich56.3%
 
Carlson40.0%
 
0.0%
 
Other3.7%


TraversePerpich49.1%
 
Carlson48.3%
 
0.0%
 
Other2.6%


WabashaPerpich43.5%
 
Carlson53.5%
 
0.0%
 
Other3.0%


WadenaPerpich44.6%
 
Carlson52.0%
 
0.0%
 
Other3.4%


WasecaPerpich42.2%
 
Carlson55.0%
 
0.0%
 
Other2.8%


WashingtonPerpich36.5%
 
Carlson60.4%
 
0.0%
 
Other3.1%


WatonwanPerpich42.3%
 
Carlson55.5%
 
0.0%
 
Other2.2%


WilkinPerpich53.5%
 
Carlson43.6%
 
0.0%
 
Other2.9%


WinonaPerpich47.1%
 
Carlson49.7%
 
0.0%
 
Other3.2%


WrightPerpich51.5%
 
Carlson45.4%
 
0.0%
 
Other3.1%


Yellow MedicinePerpich44.9%
 
Carlson53.3%
 
0.0%
 
Other1.8%


National DataGraph for 1990 - Minnesota Results for 1990

Login

Terms of Use - DCMA Policy - Privacy Policy and Cookies


© Dave Leip's Atlas of U.S. Elections, LLC 2019 All Rights Reserved