1990 Gubernatorial General Election Data Graphs - Nevada
by County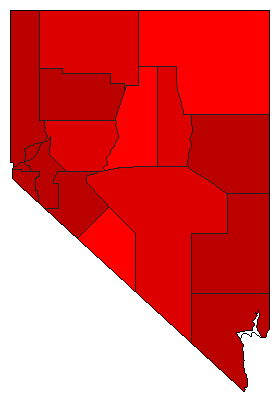
| Churchill | Miller | 56.9% | |
| Gallaway | 37.3% | |
| 0.0% | |
| Other | 5.8% | |
| Clark | Miller | 66.1% | |
| Gallaway | 28.8% | |
| 0.0% | |
| Other | 5.1% | |
| Douglas | Miller | 61.9% | |
| Gallaway | 32.8% | |
| 0.0% | |
| Other | 5.3% | |
| Elko | Miller | 46.7% | |
| Gallaway | 45.8% | |
| 0.0% | |
| Other | 7.4% | |
| Esmeralda | Miller | 48.9% | |
| Gallaway | 42.3% | |
| 0.0% | |
| Other | 8.8% | |
| Eureka | Miller | 51.0% | |
| Gallaway | 41.0% | |
| 0.0% | |
| Other | 8.1% | |
| Humboldt | Miller | 55.9% | |
| Gallaway | 38.0% | |
| 0.0% | |
| Other | 6.1% | |
| Lander | Miller | 47.9% | |
| Gallaway | 46.3% | |
| 0.0% | |
| Other | 5.9% | |
| Lincoln | Miller | 69.3% | |
| Gallaway | 24.9% | |
| 0.0% | |
| Other | 5.7% | |
| Lyon | Miller | 67.4% | |
| Gallaway | 28.0% | |
| 0.0% | |
| Other | 4.6% | |
| Mineral | Miller | 67.6% | |
| Gallaway | 27.2% | |
| 0.0% | |
| Other | 5.2% | |
| Nye | Miller | 54.6% | |
| Gallaway | 36.5% | |
| 0.0% | |
| Other | 8.9% | |
| Pershing | Miller | 60.7% | |
| Gallaway | 31.7% | |
| 0.0% | |
| Other | 7.6% | |
| Storey | Miller | 68.1% | |
| Gallaway | 25.5% | |
| 0.0% | |
| Other | 6.4% | |
| Washoe | Miller | 66.3% | |
| Gallaway | 28.5% | |
| 0.0% | |
| Other | 5.2% | |
| White Pine | Miller | 66.4% | |
| Gallaway | 24.9% | |
| 0.0% | |
| Other | 8.6% | |
City| Carson City | Miller | 63.6% | |
| Gallaway | 31.2% | |
| 0.0% | |
| Other | 5.2% | |