1990 Gubernatorial General Election Data Graphs - New Mexico
by County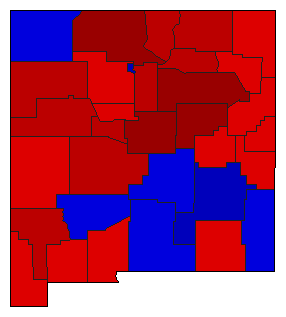
| Bernalillo | King | 51.1% | |
| Bond | 48.6% | |
| 0.0% | |
| Other | 0.3% | |
| Catron | King | 52.9% | |
| Bond | 46.4% | |
| 0.0% | |
| Other | 0.7% | |
| Chaves | King | 39.5% | |
| Bond | 60.3% | |
| 0.0% | |
| Other | 0.1% | |
| Cibola | King | 67.2% | |
| Bond | 32.7% | |
| 0.0% | |
| Other | 0.1% | |
| Colfax | King | 61.7% | |
| Bond | 38.3% | |
| 0.0% | |
| Curry | King | 51.3% | |
| Bond | 48.6% | |
| 0.0% | |
| Other | 0.1% | |
| De Baca | King | 50.3% | |
| Bond | 49.5% | |
| 0.0% | |
| Other | 0.2% | |
| Dona Ana | King | 50.1% | |
| Bond | 49.8% | |
| 0.0% | |
| Other | 0.2% | |
| Eddy | King | 52.7% | |
| Bond | 47.1% | |
| 0.0% | |
| Other | 0.1% | |
| Grant | King | 61.6% | |
| Bond | 38.2% | |
| 0.0% | |
| Other | 0.2% | |
| Guadalupe | King | 71.6% | |
| Bond | 28.4% | |
| 0.0% | |
| Harding | King | 56.5% | |
| Bond | 43.5% | |
| 0.0% | |
| Hidalgo | King | 56.8% | |
| Bond | 43.2% | |
| 0.0% | |
| Lea | King | 41.6% | |
| Bond | 58.3% | |
| 0.0% | |
| Other | 0.1% | |
| Lincoln | King | 41.7% | |
| Bond | 58.0% | |
| 0.0% | |
| Other | 0.3% | |
| Los Alamos | King | 38.6% | |
| Bond | 60.9% | |
| 0.0% | |
| Other | 0.5% | |
| Luna | King | 50.8% | |
| Bond | 48.8% | |
| 0.0% | |
| Other | 0.4% | |
| McKinley | King | 67.2% | |
| Bond | 32.8% | |
| 0.0% | |
| Mora | King | 66.8% | |
| Bond | 33.2% | |
| 0.0% | |
| Otero | King | 47.4% | |
| Bond | 52.4% | |
| 0.0% | |
| Other | 0.3% | |
| Quay | King | 57.9% | |
| Bond | 42.0% | |
| 0.0% | |
| Other | 0.0% | |
| Rio Arriba | King | 74.6% | |
| Bond | 25.4% | |
| 0.0% | |
| Roosevelt | King | 50.2% | |
| Bond | 49.7% | |
| 0.0% | |
| Other | 0.1% | |
| Sandoval | King | 57.5% | |
| Bond | 42.1% | |
| 0.0% | |
| Other | 0.4% | |
| San Juan | King | 49.5% | |
| Bond | 50.1% | |
| 0.0% | |
| Other | 0.4% | |
| San Miguel | King | 77.1% | |
| Bond | 22.9% | |
| 0.0% | |
| Other | 0.0% | |
| Santa Fe | King | 68.8% | |
| Bond | 30.7% | |
| 0.0% | |
| Other | 0.5% | |
| Sierra | King | 48.8% | |
| Bond | 50.8% | |
| 0.0% | |
| Other | 0.4% | |
| Socorro | King | 60.9% | |
| Bond | 39.0% | |
| 0.0% | |
| Other | 0.2% | |
| Taos | King | 68.6% | |
| Bond | 31.3% | |
| 0.0% | |
| Other | 0.1% | |
| Torrance | King | 71.6% | |
| Bond | 28.3% | |
| 0.0% | |
| Other | 0.1% | |
| Union | King | 53.0% | |
| Bond | 46.8% | |
| 0.0% | |
| Other | 0.1% | |
| Valencia | King | 61.9% | |
| Bond | 38.1% | |
| 0.0% | |
| Other | 0.0% | |