1990 Gubernatorial General Election Data Graphs - South Carolina
Note: The Google advertisement links below may advocate political positions that this site does not endorse.
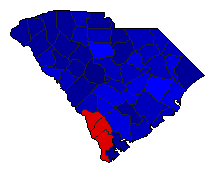
Map

AbbevilleMitchell32.3%
 
Campbell65.5%
 
0.0%
 
Other2.2%


AikenMitchell21.3%
 
Campbell75.9%
 
0.0%
 
Other2.8%


AllendaleMitchell52.0%
 
Campbell46.8%
 
0.0%
 
Other1.2%


AndersonMitchell21.1%
 
Campbell74.7%
 
0.0%
 
Other4.2%


BambergMitchell44.8%
 
Campbell54.3%
 
0.0%
 
Other0.9%


BarnwellMitchell31.6%
 
Campbell66.8%
 
0.0%
 
Other1.5%


BeaufortMitchell27.4%
 
Campbell70.2%
 
0.0%
 
Other2.3%


BerkeleyMitchell29.0%
 
Campbell68.6%
 
0.0%
 
Other2.4%


CalhounMitchell34.1%
 
Campbell64.4%
 
0.0%
 
Other1.5%


CharlestonMitchell31.4%
 
Campbell66.1%
 
0.0%
 
Other2.5%


CherokeeMitchell24.9%
 
Campbell69.4%
 
0.0%
 
Other5.7%


ChesterMitchell33.1%
 
Campbell64.5%
 
0.0%
 
Other2.3%


ChesterfieldMitchell29.8%
 
Campbell68.3%
 
0.0%
 
Other1.9%


ClarendonMitchell46.5%
 
Campbell52.8%
 
0.0%
 
Other0.7%


ColletonMitchell39.4%
 
Campbell59.1%
 
0.0%
 
Other1.4%


DarlingtonMitchell33.0%
 
Campbell65.3%
 
0.0%
 
Other1.6%


DillonMitchell37.5%
 
Campbell61.5%
 
0.0%
 
Other1.0%


DorchesterMitchell27.0%
 
Campbell70.5%
 
0.0%
 
Other2.5%


EdgefieldMitchell37.4%
 
Campbell61.1%
 
0.0%
 
Other1.5%


FairfieldMitchell48.6%
 
Campbell49.8%
 
0.0%
 
Other1.7%


FlorenceMitchell31.1%
 
Campbell67.1%
 
0.0%
 
Other1.7%


GeorgetownMitchell38.3%
 
Campbell60.0%
 
0.0%
 
Other1.7%


GreenvilleMitchell19.3%
 
Campbell77.1%
 
0.0%
 
Other3.6%


GreenwoodMitchell27.5%
 
Campbell70.0%
 
0.0%
 
Other2.5%


HamptonMitchell50.2%
 
Campbell48.3%
 
0.0%
 
Other1.5%


HorryMitchell20.6%
 
Campbell77.8%
 
0.0%
 
Other1.6%


JasperMitchell57.0%
 
Campbell42.2%
 
0.0%
 
Other0.8%


KershawMitchell21.6%
 
Campbell75.4%
 
0.0%
 
Other3.0%


LancasterMitchell23.2%
 
Campbell75.2%
 
0.0%
 
Other1.6%


LaurensMitchell26.3%
 
Campbell71.0%
 
0.0%
 
Other2.7%


LeeMitchell45.2%
 
Campbell53.8%
 
0.0%
 
Other1.1%


LexingtonMitchell12.2%
 
Campbell84.2%
 
0.0%
 
Other3.6%


McCormickMitchell46.7%
 
Campbell51.4%
 
0.0%
 
Other1.9%


MarionMitchell39.0%
 
Campbell59.7%
 
0.0%
 
Other1.3%


MarlboroMitchell38.3%
 
Campbell60.6%
 
0.0%
 
Other1.1%


NewberryMitchell23.7%
 
Campbell73.5%
 
0.0%
 
Other2.8%


OconeeMitchell19.9%
 
Campbell75.2%
 
0.0%
 
Other4.9%


OrangeburgMitchell45.6%
 
Campbell53.1%
 
0.0%
 
Other1.3%


PickensMitchell17.0%
 
Campbell79.1%
 
0.0%
 
Other3.8%


RichlandMitchell34.0%
 
Campbell64.0%
 
0.0%
 
Other2.0%


SaludaMitchell25.2%
 
Campbell71.4%
 
0.0%
 
Other3.4%


SpartanburgMitchell23.9%
 
Campbell71.8%
 
0.0%
 
Other4.3%


SumterMitchell33.4%
 
Campbell64.7%
 
0.0%
 
Other1.8%


UnionMitchell27.4%
 
Campbell69.4%
 
0.0%
 
Other3.2%


WilliamsburgMitchell49.5%
 
Campbell49.8%
 
0.0%
 
Other0.7%


YorkMitchell21.8%
 
Campbell75.6%
 
0.0%
 
Other2.6%


National DataGraph for 1990 - South Carolina Results for 1990

Login

Terms of Use - DCMA Policy - Privacy Policy and Cookies


© Dave Leip's Atlas of U.S. Elections, LLC 2019 All Rights Reserved