1990 Senatorial General Election Data Graphs - Tennessee
by County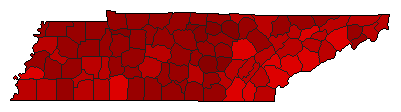
| Anderson | Gore | 69.1% | |
| Hawkins | 29.1% | |
| 0.0% | |
| Other | 1.7% | |
| Bedford | Gore | 77.1% | |
| Hawkins | 21.2% | |
| 0.0% | |
| Other | 1.7% | |
| Benton | Gore | 76.6% | |
| Hawkins | 19.5% | |
| 0.0% | |
| Other | 3.9% | |
| Bledsoe | Gore | 61.5% | |
| Hawkins | 36.8% | |
| 0.0% | |
| Other | 1.7% | |
| Blount | Gore | 59.8% | |
| Hawkins | 38.0% | |
| 0.0% | |
| Other | 2.2% | |
| Bradley | Gore | 56.8% | |
| Hawkins | 40.6% | |
| 0.0% | |
| Other | 2.6% | |
| Campbell | Gore | 72.8% | |
| Hawkins | 25.9% | |
| 0.0% | |
| Other | 1.3% | |
| Cannon | Gore | 73.5% | |
| Hawkins | 23.4% | |
| 0.0% | |
| Other | 3.0% | |
| Carroll | Gore | 75.3% | |
| Hawkins | 22.7% | |
| 0.0% | |
| Other | 1.9% | |
| Carter | Gore | 61.0% | |
| Hawkins | 36.3% | |
| 0.0% | |
| Other | 2.6% | |
| Cheatham | Gore | 71.1% | |
| Hawkins | 26.3% | |
| 0.0% | |
| Other | 2.6% | |
| Chester | Gore | 65.2% | |
| Hawkins | 33.7% | |
| 0.0% | |
| Other | 1.1% | |
| Claiborne | Gore | 71.6% | |
| Hawkins | 27.0% | |
| 0.0% | |
| Other | 1.4% | |
| Clay | Gore | 75.2% | |
| Hawkins | 23.2% | |
| 0.0% | |
| Other | 1.6% | |
| Cocke | Gore | 66.3% | |
| Hawkins | 30.4% | |
| 0.0% | |
| Other | 3.3% | |
| Coffee | Gore | 64.9% | |
| Hawkins | 32.7% | |
| 0.0% | |
| Other | 2.4% | |
| Crockett | Gore | 69.7% | |
| Hawkins | 27.4% | |
| 0.0% | |
| Other | 2.9% | |
| Cumberland | Gore | 57.6% | |
| Hawkins | 39.3% | |
| 0.0% | |
| Other | 3.1% | |
| Davidson | Gore | 72.0% | |
| Hawkins | 25.2% | |
| 0.0% | |
| Other | 2.7% | |
| Decatur | Gore | 69.0% | |
| Hawkins | 29.3% | |
| 0.0% | |
| Other | 1.7% | |
| DeKalb | Gore | 74.1% | |
| Hawkins | 23.2% | |
| 0.0% | |
| Other | 2.7% | |
| Dickson | Gore | 75.5% | |
| Hawkins | 22.8% | |
| 0.0% | |
| Other | 1.7% | |
| Dyer | Gore | 69.3% | |
| Hawkins | 26.9% | |
| 0.0% | |
| Other | 3.7% | |
| Fayette | Gore | 65.2% | |
| Hawkins | 31.2% | |
| 0.0% | |
| Other | 3.6% | |
| Fentress | Gore | 72.3% | |
| Hawkins | 26.0% | |
| 0.0% | |
| Other | 1.7% | |
| Franklin | Gore | 75.4% | |
| Hawkins | 23.0% | |
| 0.0% | |
| Other | 1.7% | |
| Gibson | Gore | 79.1% | |
| Hawkins | 19.0% | |
| 0.0% | |
| Other | 1.9% | |
| Giles | Gore | 79.6% | |
| Hawkins | 18.9% | |
| 0.0% | |
| Other | 1.4% | |
| Grainger | Gore | 58.7% | |
| Hawkins | 39.2% | |
| 0.0% | |
| Other | 2.1% | |
| Greene | Gore | 59.4% | |
| Hawkins | 38.6% | |
| 0.0% | |
| Other | 2.0% | |
| Grundy | Gore | 77.4% | |
| Hawkins | 21.3% | |
| 0.0% | |
| Other | 1.3% | |
| Hamblen | Gore | 61.7% | |
| Hawkins | 36.6% | |
| 0.0% | |
| Other | 1.8% | |
| Hamilton | Gore | 56.4% | |
| Hawkins | 40.3% | |
| 0.0% | |
| Other | 3.3% | |
| Hancock | Gore | 70.8% | |
| Hawkins | 28.3% | |
| 0.0% | |
| Other | 1.0% | |
| Hardeman | Gore | 77.0% | |
| Hawkins | 20.6% | |
| 0.0% | |
| Other | 2.4% | |
| Hardin | Gore | 69.8% | |
| Hawkins | 28.7% | |
| 0.0% | |
| Other | 1.5% | |
| Hawkins | Gore | 68.1% | |
| Hawkins | 30.8% | |
| 0.0% | |
| Other | 1.1% | |
| Haywood | Gore | 72.8% | |
| Hawkins | 24.6% | |
| 0.0% | |
| Other | 2.6% | |
| Henderson | Gore | 61.1% | |
| Hawkins | 37.5% | |
| 0.0% | |
| Other | 1.4% | |
| Henry | Gore | 74.3% | |
| Hawkins | 23.4% | |
| 0.0% | |
| Other | 2.3% | |
| Hickman | Gore | 79.3% | |
| Hawkins | 19.2% | |
| 0.0% | |
| Other | 1.5% | |
| Houston | Gore | 82.2% | |
| Hawkins | 15.0% | |
| 0.0% | |
| Other | 2.8% | |
| Humphreys | Gore | 78.2% | |
| Hawkins | 19.1% | |
| 0.0% | |
| Other | 2.7% | |
| Jackson | Gore | 83.2% | |
| Hawkins | 15.5% | |
| 0.0% | |
| Other | 1.3% | |
| Jefferson | Gore | 60.3% | |
| Hawkins | 37.0% | |
| 0.0% | |
| Other | 2.7% | |
| Johnson | Gore | 63.3% | |
| Hawkins | 34.6% | |
| 0.0% | |
| Other | 2.1% | |
| Knox | Gore | 65.4% | |
| Hawkins | 32.8% | |
| 0.0% | |
| Other | 1.8% | |
| Lake | Gore | 78.5% | |
| Hawkins | 18.3% | |
| 0.0% | |
| Other | 3.2% | |
| Lauderdale | Gore | 72.7% | |
| Hawkins | 24.7% | |
| 0.0% | |
| Other | 2.7% | |
| Lawrence | Gore | 73.0% | |
| Hawkins | 26.2% | |
| 0.0% | |
| Other | 0.8% | |
| Lewis | Gore | 79.9% | |
| Hawkins | 18.9% | |
| 0.0% | |
| Other | 1.1% | |
| Lincoln | Gore | 75.9% | |
| Hawkins | 22.3% | |
| 0.0% | |
| Other | 1.7% | |
| Loudon | Gore | 58.2% | |
| Hawkins | 38.9% | |
| 0.0% | |
| Other | 2.9% | |
| McMinn | Gore | 62.8% | |
| Hawkins | 35.4% | |
| 0.0% | |
| Other | 1.8% | |
| McNairy | Gore | 68.1% | |
| Hawkins | 31.1% | |
| 0.0% | |
| Other | 0.9% | |
| Macon | Gore | 71.2% | |
| Hawkins | 27.1% | |
| 0.0% | |
| Other | 1.7% | |
| Madison | Gore | 73.4% | |
| Hawkins | 24.2% | |
| 0.0% | |
| Other | 2.4% | |
| Marion | Gore | 71.0% | |
| Hawkins | 26.5% | |
| 0.0% | |
| Other | 2.5% | |
| Marshall | Gore | 70.4% | |
| Hawkins | 26.9% | |
| 0.0% | |
| Other | 2.6% | |
| Maury | Gore | 68.2% | |
| Hawkins | 30.1% | |
| 0.0% | |
| Other | 1.7% | |
| Meigs | Gore | 61.0% | |
| Hawkins | 37.7% | |
| 0.0% | |
| Other | 1.4% | |
| Monroe | Gore | 57.8% | |
| Hawkins | 40.9% | |
| 0.0% | |
| Other | 1.3% | |
| Montgomery | Gore | 78.8% | |
| Hawkins | 19.5% | |
| 0.0% | |
| Other | 1.7% | |
| Moore | Gore | 73.7% | |
| Hawkins | 24.7% | |
| 0.0% | |
| Other | 1.6% | |
| Morgan | Gore | 74.4% | |
| Hawkins | 23.3% | |
| 0.0% | |
| Other | 2.3% | |
| Obion | Gore | 76.9% | |
| Hawkins | 20.5% | |
| 0.0% | |
| Other | 2.6% | |
| Overton | Gore | 83.2% | |
| Hawkins | 15.0% | |
| 0.0% | |
| Other | 1.8% | |
| Perry | Gore | 79.0% | |
| Hawkins | 20.1% | |
| 0.0% | |
| Other | 0.9% | |
| Pickett | Gore | 65.1% | |
| Hawkins | 33.7% | |
| 0.0% | |
| Other | 1.2% | |
| Polk | Gore | 69.7% | |
| Hawkins | 28.9% | |
| 0.0% | |
| Other | 1.4% | |
| Putnam | Gore | 75.1% | |
| Hawkins | 22.9% | |
| 0.0% | |
| Other | 2.0% | |
| Rhea | Gore | 60.8% | |
| Hawkins | 38.0% | |
| 0.0% | |
| Other | 1.2% | |
| Roane | Gore | 69.7% | |
| Hawkins | 28.2% | |
| 0.0% | |
| Other | 2.1% | |
| Robertson | Gore | 78.0% | |
| Hawkins | 19.1% | |
| 0.0% | |
| Other | 2.9% | |
| Rutherford | Gore | 70.6% | |
| Hawkins | 26.8% | |
| 0.0% | |
| Other | 2.6% | |
| Scott | Gore | 67.0% | |
| Hawkins | 30.5% | |
| 0.0% | |
| Other | 2.4% | |
| Sequatchie | Gore | 64.0% | |
| Hawkins | 34.6% | |
| 0.0% | |
| Other | 1.4% | |
| Sevier | Gore | 58.6% | |
| Hawkins | 38.6% | |
| 0.0% | |
| Other | 2.8% | |
| Shelby | Gore | 64.3% | |
| Hawkins | 32.4% | |
| 0.0% | |
| Other | 3.3% | |
| Smith | Gore | 84.0% | |
| Hawkins | 14.4% | |
| 0.0% | |
| Other | 1.6% | |
| Stewart | Gore | 76.2% | |
| Hawkins | 20.6% | |
| 0.0% | |
| Other | 3.2% | |
| Sullivan | Gore | 65.3% | |
| Hawkins | 32.5% | |
| 0.0% | |
| Other | 2.3% | |
| Sumner | Gore | 73.2% | |
| Hawkins | 25.0% | |
| 0.0% | |
| Other | 1.9% | |
| Tipton | Gore | 59.1% | |
| Hawkins | 36.4% | |
| 0.0% | |
| Other | 4.5% | |
| Trousdale | Gore | 88.7% | |
| Hawkins | 10.3% | |
| 0.0% | |
| Other | 1.0% | |
| Unicoi | Gore | 70.0% | |
| Hawkins | 28.5% | |
| 0.0% | |
| Other | 1.5% | |
| Union | Gore | 61.5% | |
| Hawkins | 36.7% | |
| 0.0% | |
| Other | 1.8% | |
| Van Buren | Gore | 84.7% | |
| Hawkins | 14.4% | |
| 0.0% | |
| Other | 0.9% | |
| Warren | Gore | 81.8% | |
| Hawkins | 15.6% | |
| 0.0% | |
| Other | 2.6% | |
| Washington | Gore | 71.4% | |
| Hawkins | 26.4% | |
| 0.0% | |
| Other | 2.2% | |
| Wayne | Gore | 57.7% | |
| Hawkins | 40.7% | |
| 0.0% | |
| Other | 1.5% | |
| Weakley | Gore | 78.0% | |
| Hawkins | 19.5% | |
| 0.0% | |
| Other | 2.5% | |
| White | Gore | 77.4% | |
| Hawkins | 19.5% | |
| 0.0% | |
| Other | 3.1% | |
| Williamson | Gore | 61.2% | |
| Hawkins | 36.6% | |
| 0.0% | |
| Other | 2.2% | |
| Wilson | Gore | 77.6% | |
| Hawkins | 20.6% | |
| 0.0% | |
| Other | 1.8% | |