1992 Presidential General Election Data Graphs - Minnesota
Note: The Google advertisement links below may advocate political positions that this site does not endorse.
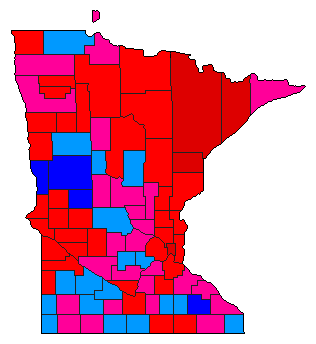
Map

AitkinClinton45.0%
 
Bush28.5%
 
Perot25.8%
 
Other0.8%


AnokaClinton42.0%
 
Bush30.3%
 
Perot27.0%
 
Other0.6%


BeckerClinton36.2%
 
Bush39.6%
 
Perot23.6%
 
Other0.6%


BeltramiClinton45.1%
 
Bush32.6%
 
Perot21.7%
 
Other0.6%


BentonClinton35.9%
 
Bush35.2%
 
Perot28.2%
 
Other0.8%


Big StoneClinton47.1%
 
Bush30.8%
 
Perot21.6%
 
Other0.5%


Blue EarthClinton41.4%
 
Bush31.6%
 
Perot26.2%
 
Other0.7%


BrownClinton31.4%
 
Bush39.6%
 
Perot28.2%
 
Other0.8%


CarltonClinton52.5%
 
Bush26.6%
 
Perot20.4%
 
Other0.6%


CarverClinton31.4%
 
Bush38.3%
 
Perot29.9%
 
Other0.4%


CassClinton40.2%
 
Bush35.1%
 
Perot24.1%
 
Other0.7%


ChippewaClinton44.3%
 
Bush32.4%
 
Perot22.7%
 
Other0.6%


ChisagoClinton41.3%
 
Bush28.1%
 
Perot29.8%
 
Other0.8%


ClayClinton41.9%
 
Bush41.2%
 
Perot16.3%
 
Other0.6%


ClearwaterClinton42.2%
 
Bush35.0%
 
Perot22.4%
 
Other0.4%


CookClinton38.4%
 
Bush33.5%
 
Perot26.9%
 
Other1.2%


CottonwoodClinton35.8%
 
Bush37.3%
 
Perot26.3%
 
Other0.6%


Crow WingClinton36.3%
 
Bush37.1%
 
Perot25.9%
 
Other0.7%


DakotaClinton40.5%
 
Bush33.3%
 
Perot25.6%
 
Other0.6%


DodgeClinton32.9%
 
Bush38.2%
 
Perot28.0%
 
Other0.9%


DouglasClinton33.1%
 
Bush40.1%
 
Perot26.1%
 
Other0.7%


FaribaultClinton36.5%
 
Bush37.6%
 
Perot25.4%
 
Other0.5%


FillmoreClinton37.3%
 
Bush33.6%
 
Perot28.3%
 
Other0.8%


FreebornClinton43.6%
 
Bush28.6%
 
Perot27.4%
 
Other0.5%


GoodhueClinton37.3%
 
Bush34.5%
 
Perot27.2%
 
Other1.0%


GrantClinton42.6%
 
Bush32.8%
 
Perot24.1%
 
Other0.5%


HennepinClinton47.5%
 
Bush30.6%
 
Perot21.1%
 
Other0.8%


HoustonClinton35.8%
 
Bush36.9%
 
Perot25.8%
 
Other1.5%


HubbardClinton39.1%
 
Bush37.6%
 
Perot22.7%
 
Other0.6%


IsantiClinton40.3%
 
Bush29.8%
 
Perot29.2%
 
Other0.7%


ItascaClinton46.2%
 
Bush28.6%
 
Perot24.7%
 
Other0.6%


JacksonClinton39.7%
 
Bush29.2%
 
Perot30.7%
 
Other0.5%


KanabecClinton40.3%
 
Bush29.8%
 
Perot29.2%
 
Other0.7%


KandiyohiClinton40.3%
 
Bush34.5%
 
Perot24.8%
 
Other0.5%


KittsonClinton43.8%
 
Bush36.8%
 
Perot18.7%
 
Other0.7%


KoochichingClinton46.5%
 
Bush26.2%
 
Perot26.7%
 
Other0.6%


Lac Qui ParleClinton47.1%
 
Bush28.9%
 
Perot23.4%
 
Other0.6%


LakeClinton53.7%
 
Bush23.0%
 
Perot22.6%
 
Other0.6%


Lake of the WoodsClinton36.1%
 
Bush34.7%
 
Perot28.6%
 
Other0.6%


Le SueurClinton39.0%
 
Bush32.3%
 
Perot28.1%
 
Other0.6%


LincolnClinton42.8%
 
Bush29.8%
 
Perot26.6%
 
Other0.8%


LyonClinton36.4%
 
Bush37.3%
 
Perot25.8%
 
Other0.6%


McLeodClinton32.1%
 
Bush35.3%
 
Perot32.1%
 
Other0.5%


MahnomenClinton43.3%
 
Bush35.7%
 
Perot20.2%
 
Other0.7%


MarshallClinton39.8%
 
Bush36.8%
 
Perot22.5%
 
Other0.9%


MartinClinton34.6%
 
Bush38.2%
 
Perot26.6%
 
Other0.5%


MeekerClinton36.6%
 
Bush33.2%
 
Perot29.6%
 
Other0.6%


Mille LacsClinton39.9%
 
Bush30.7%
 
Perot28.6%
 
Other0.8%


MorrisonClinton38.7%
 
Bush34.9%
 
Perot25.7%
 
Other0.7%


MowerClinton49.2%
 
Bush25.5%
 
Perot24.7%
 
Other0.6%


MurrayClinton38.2%
 
Bush30.9%
 
Perot30.5%
 
Other0.4%


NicolletClinton40.3%
 
Bush33.9%
 
Perot25.3%
 
Other0.6%


NoblesClinton37.8%
 
Bush35.7%
 
Perot26.0%
 
Other0.4%


NormanClinton43.3%
 
Bush37.4%
 
Perot18.8%
 
Other0.5%


OlmstedClinton33.6%
 
Bush41.3%
 
Perot24.4%
 
Other0.7%


Otter TailClinton34.4%
 
Bush41.5%
 
Perot23.5%
 
Other0.5%


PenningtonClinton40.5%
 
Bush33.9%
 
Perot25.1%
 
Other0.4%


PineClinton45.6%
 
Bush26.3%
 
Perot27.3%
 
Other0.8%


PipestoneClinton34.3%
 
Bush37.8%
 
Perot27.6%
 
Other0.3%


PolkClinton39.2%
 
Bush39.0%
 
Perot21.3%
 
Other0.6%


PopeClinton43.9%
 
Bush31.6%
 
Perot23.3%
 
Other1.3%


RamseyClinton52.0%
 
Bush27.1%
 
Perot20.1%
 
Other0.8%


Red LakeClinton46.3%
 
Bush31.4%
 
Perot21.4%
 
Other0.8%


RedwoodClinton30.7%
 
Bush38.2%
 
Perot30.4%
 
Other0.6%


RenvilleClinton38.3%
 
Bush32.0%
 
Perot29.1%
 
Other0.6%


RiceClinton45.2%
 
Bush29.1%
 
Perot25.1%
 
Other0.6%


RockClinton37.6%
 
Bush38.7%
 
Perot23.3%
 
Other0.4%


RoseauClinton32.3%
 
Bush38.3%
 
Perot28.9%
 
Other0.5%


St. LouisClinton56.8%
 
Bush22.6%
 
Perot20.0%
 
Other0.7%


ScottClinton34.8%
 
Bush33.9%
 
Perot30.7%
 
Other0.5%


SherburneClinton35.9%
 
Bush33.6%
 
Perot29.9%
 
Other0.6%


SibleyClinton33.7%
 
Bush32.2%
 
Perot33.5%
 
Other0.6%


StearnsClinton36.1%
 
Bush37.9%
 
Perot25.0%
 
Other0.9%


SteeleClinton32.6%
 
Bush37.8%
 
Perot28.8%
 
Other0.8%


StevensClinton42.4%
 
Bush38.3%
 
Perot18.7%
 
Other0.6%


SwiftClinton49.7%
 
Bush26.8%
 
Perot22.7%
 
Other0.8%


ToddClinton36.6%
 
Bush35.9%
 
Perot26.8%
 
Other0.7%


TraverseClinton42.4%
 
Bush33.9%
 
Perot23.4%
 
Other0.3%


WabashaClinton36.6%
 
Bush33.2%
 
Perot29.5%
 
Other0.7%


WadenaClinton36.6%
 
Bush38.9%
 
Perot24.0%
 
Other0.5%


WasecaClinton34.9%
 
Bush34.6%
 
Perot29.1%
 
Other1.3%


WashingtonClinton41.9%
 
Bush31.1%
 
Perot26.4%
 
Other0.6%


WatonwanClinton37.6%
 
Bush33.5%
 
Perot28.2%
 
Other0.6%


WilkinClinton32.0%
 
Bush46.3%
 
Perot21.3%
 
Other0.4%


WinonaClinton39.6%
 
Bush35.0%
 
Perot24.4%
 
Other1.0%


WrightClinton35.5%
 
Bush33.1%
 
Perot30.8%
 
Other0.6%


Yellow MedicineClinton41.9%
 
Bush30.8%
 
Perot26.6%
 
Other0.7%


National DataGraph for 1992 - Minnesota Results for 1992

Login

Terms of Use - DCMA Policy - Privacy Policy and Cookies


© Dave Leip's Atlas of U.S. Elections, LLC 2019 All Rights Reserved