1992 Presidential General Election Data Graphs - New Jersey
by County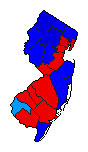
| Atlantic | Clinton | 43.9% | |
| Bush | 38.0% | |
| Perot | 17.6% | |
| Other | 0.5% | |
| Bergen | Clinton | 42.4% | |
| Bush | 44.2% | |
| Perot | 12.9% | |
| Other | 0.4% | |
| Burlington | Clinton | 42.0% | |
| Bush | 36.8% | |
| Perot | 20.4% | |
| Other | 0.9% | |
| Camden | Clinton | 49.7% | |
| Bush | 31.9% | |
| Perot | 17.6% | |
| Other | 0.8% | |
| Cape May | Clinton | 35.5% | |
| Bush | 44.0% | |
| Perot | 20.1% | |
| Other | 0.5% | |
| Cumberland | Clinton | 42.6% | |
| Bush | 36.9% | |
| Perot | 19.0% | |
| Other | 1.4% | |
| Essex | Clinton | 57.1% | |
| Bush | 32.2% | |
| Perot | 9.7% | |
| Other | 0.9% | |
| Gloucester | Clinton | 40.6% | |
| Bush | 35.7% | |
| Perot | 23.1% | |
| Other | 0.7% | |
| Hudson | Clinton | 53.9% | |
| Bush | 35.9% | |
| Perot | 7.9% | |
| Other | 2.3% | |
| Hunterdon | Clinton | 28.6% | |
| Bush | 46.6% | |
| Perot | 23.6% | |
| Other | 1.3% | |
| Mercer | Clinton | 49.1% | |
| Bush | 34.7% | |
| Perot | 15.5% | |
| Other | 0.6% | |
| Middlesex | Clinton | 45.2% | |
| Bush | 38.1% | |
| Perot | 15.8% | |
| Other | 0.9% | |
| Monmouth | Clinton | 38.2% | |
| Bush | 44.2% | |
| Perot | 17.1% | |
| Other | 0.5% | |
| Morris | Clinton | 32.3% | |
| Bush | 51.8% | |
| Perot | 15.5% | |
| Other | 0.4% | |
| Ocean | Clinton | 34.9% | |
| Bush | 44.4% | |
| Perot | 19.3% | |
| Other | 1.5% | |
| Passaic | Clinton | 42.5% | |
| Bush | 43.1% | |
| Perot | 13.0% | |
| Other | 1.3% | |
| Salem | Clinton | 36.0% | |
| Bush | 37.1% | |
| Perot | 26.0% | |
| Other | 0.8% | |
| Somerset | Clinton | 35.5% | |
| Bush | 46.4% | |
| Perot | 17.4% | |
| Other | 0.7% | |
| Sussex | Clinton | 25.9% | |
| Bush | 51.7% | |
| Perot | 22.0% | |
| Other | 0.4% | |
| Union | Clinton | 46.0% | |
| Bush | 41.8% | |
| Perot | 11.4% | |
| Other | 0.8% | |
| Warren | Clinton | 31.3% | |
| Bush | 44.5% | |
| Perot | 23.8% | |
| Other | 0.4% | |