1992 Presidential General Election Data Graphs - South Carolina
by County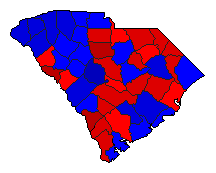
| Abbeville | Clinton | 47.6% | |
| Bush | 39.8% | |
| Perot | 12.4% | |
| Other | 0.3% | |
| Aiken | Clinton | 31.6% | |
| Bush | 55.0% | |
| Perot | 12.9% | |
| Other | 0.4% | |
| Allendale | Clinton | 62.5% | |
| Bush | 30.4% | |
| Perot | 6.1% | |
| Other | 1.0% | |
| Anderson | Clinton | 33.5% | |
| Bush | 51.7% | |
| Perot | 14.5% | |
| Other | 0.3% | |
| Bamberg | Clinton | 59.8% | |
| Bush | 33.3% | |
| Perot | 6.3% | |
| Other | 0.6% | |
| Barnwell | Clinton | 40.9% | |
| Bush | 49.2% | |
| Perot | 9.2% | |
| Other | 0.7% | |
| Beaufort | Clinton | 36.6% | |
| Bush | 47.1% | |
| Perot | 15.9% | |
| Other | 0.4% | |
| Berkeley | Clinton | 35.3% | |
| Bush | 50.9% | |
| Perot | 13.1% | |
| Other | 0.7% | |
| Calhoun | Clinton | 47.9% | |
| Bush | 41.8% | |
| Perot | 9.8% | |
| Other | 0.4% | |
| Charleston | Clinton | 40.6% | |
| Bush | 48.0% | |
| Perot | 10.5% | |
| Other | 0.9% | |
| Cherokee | Clinton | 37.5% | |
| Bush | 47.3% | |
| Perot | 15.0% | |
| Other | 0.2% | |
| Chester | Clinton | 53.1% | |
| Bush | 33.5% | |
| Perot | 13.1% | |
| Other | 0.3% | |
| Chesterfield | Clinton | 50.8% | |
| Bush | 37.3% | |
| Perot | 11.7% | |
| Other | 0.2% | |
| Clarendon | Clinton | 55.1% | |
| Bush | 37.9% | |
| Perot | 6.8% | |
| Other | 0.2% | |
| Colleton | Clinton | 48.2% | |
| Bush | 40.2% | |
| Perot | 11.0% | |
| Other | 0.6% | |
| Darlington | Clinton | 44.9% | |
| Bush | 44.0% | |
| Perot | 9.2% | |
| Other | 1.9% | |
| Dillon | Clinton | 52.7% | |
| Bush | 38.1% | |
| Perot | 8.8% | |
| Other | 0.3% | |
| Dorchester | Clinton | 32.7% | |
| Bush | 53.5% | |
| Perot | 13.0% | |
| Other | 0.8% | |
| Edgefield | Clinton | 46.4% | |
| Bush | 45.1% | |
| Perot | 8.1% | |
| Other | 0.4% | |
| Fairfield | Clinton | 60.2% | |
| Bush | 31.1% | |
| Perot | 8.1% | |
| Other | 0.7% | |
| Florence | Clinton | 39.9% | |
| Bush | 50.8% | |
| Perot | 9.0% | |
| Other | 0.3% | |
| Georgetown | Clinton | 46.1% | |
| Bush | 42.2% | |
| Perot | 11.3% | |
| Other | 0.4% | |
| Greenville | Clinton | 30.4% | |
| Bush | 57.1% | |
| Perot | 12.0% | |
| Other | 0.4% | |
| Greenwood | Clinton | 40.3% | |
| Bush | 48.0% | |
| Perot | 11.1% | |
| Other | 0.6% | |
| Hampton | Clinton | 58.9% | |
| Bush | 32.6% | |
| Perot | 7.7% | |
| Other | 0.9% | |
| Horry | Clinton | 36.9% | |
| Bush | 45.9% | |
| Perot | 16.5% | |
| Other | 0.7% | |
| Jasper | Clinton | 59.9% | |
| Bush | 29.9% | |
| Perot | 9.5% | |
| Other | 0.6% | |
| Kershaw | Clinton | 38.1% | |
| Bush | 49.1% | |
| Perot | 12.4% | |
| Other | 0.4% | |
| Lancaster | Clinton | 44.5% | |
| Bush | 41.6% | |
| Perot | 13.7% | |
| Other | 0.2% | |
| Laurens | Clinton | 38.6% | |
| Bush | 48.5% | |
| Perot | 12.5% | |
| Other | 0.3% | |
| Lee | Clinton | 56.9% | |
| Bush | 34.9% | |
| Perot | 7.8% | |
| Other | 0.3% | |
| Lexington | Clinton | 26.5% | |
| Bush | 60.5% | |
| Perot | 12.5% | |
| Other | 0.4% | |
| McCormick | Clinton | 60.5% | |
| Bush | 29.5% | |
| Perot | 9.7% | |
| Other | 0.4% | |
| Marion | Clinton | 56.3% | |
| Bush | 35.1% | |
| Perot | 7.9% | |
| Other | 0.6% | |
| Marlboro | Clinton | 59.6% | |
| Bush | 29.5% | |
| Perot | 10.4% | |
| Other | 0.4% | |
| Newberry | Clinton | 39.7% | |
| Bush | 48.5% | |
| Perot | 11.3% | |
| Other | 0.5% | |
| Oconee | Clinton | 32.3% | |
| Bush | 50.7% | |
| Perot | 16.6% | |
| Other | 0.4% | |
| Orangeburg | Clinton | 57.2% | |
| Bush | 35.1% | |
| Perot | 7.4% | |
| Other | 0.3% | |
| Pickens | Clinton | 28.1% | |
| Bush | 57.7% | |
| Perot | 14.0% | |
| Other | 0.3% | |
| Richland | Clinton | 50.5% | |
| Bush | 41.2% | |
| Perot | 7.5% | |
| Other | 0.9% | |
| Saluda | Clinton | 38.5% | |
| Bush | 47.8% | |
| Perot | 13.4% | |
| Other | 0.2% | |
| Spartanburg | Clinton | 35.1% | |
| Bush | 51.9% | |
| Perot | 12.3% | |
| Other | 0.7% | |
| Sumter | Clinton | 44.6% | |
| Bush | 47.3% | |
| Perot | 7.8% | |
| Other | 0.4% | |
| Union | Clinton | 43.5% | |
| Bush | 43.5% | |
| Perot | 12.8% | |
| Other | 0.2% | |
| Williamsburg | Clinton | 56.6% | |
| Bush | 37.0% | |
| Perot | 6.1% | |
| Other | 0.3% | |
| York | Clinton | 36.3% | |
| Bush | 48.7% | |
| Perot | 14.7% | |
| Other | 0.3% | |