1992 Presidential General Election Data Graphs - Vermont
by County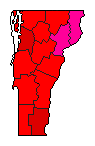
| Addison | Clinton | 47.5% | |
| Bush | 29.6% | |
| Perot | 22.2% | |
| Other | 0.7% | |
| Bennington | Clinton | 44.9% | |
| Bush | 32.4% | |
| Perot | 22.1% | |
| Other | 0.7% | |
| Caledonia | Clinton | 37.9% | |
| Bush | 35.0% | |
| Perot | 26.5% | |
| Other | 0.7% | |
| Chittenden | Clinton | 50.4% | |
| Bush | 27.2% | |
| Perot | 21.7% | |
| Other | 0.7% | |
| Essex | Clinton | 36.4% | |
| Bush | 34.6% | |
| Perot | 28.2% | |
| Other | 0.7% | |
| Franklin | Clinton | 42.7% | |
| Bush | 29.2% | |
| Perot | 27.4% | |
| Other | 0.6% | |
| Grand Isle | Clinton | 42.7% | |
| Bush | 29.9% | |
| Perot | 26.4% | |
| Other | 0.9% | |
| Lamoille | Clinton | 44.0% | |
| Bush | 28.9% | |
| Perot | 26.4% | |
| Other | 0.7% | |
| Orange | Clinton | 43.1% | |
| Bush | 31.7% | |
| Perot | 24.5% | |
| Other | 0.8% | |
| Orleans | Clinton | 41.0% | |
| Bush | 31.0% | |
| Perot | 27.2% | |
| Other | 0.7% | |
| Rutland | Clinton | 41.2% | |
| Bush | 35.2% | |
| Perot | 23.1% | |
| Other | 0.5% | |
| Washington | Clinton | 45.9% | |
| Bush | 32.1% | |
| Perot | 21.4% | |
| Other | 0.6% | |
| Windham | Clinton | 53.3% | |
| Bush | 27.2% | |
| Perot | 18.7% | |
| Other | 0.8% | |
| Windsor | Clinton | 47.5% | |
| Bush | 31.0% | |
| Perot | 20.8% | |
| Other | 0.7% | |