1994 Secretary of State General Election Data Graphs - Massachusetts
by CountyData for this Contest was Contributed by on 2016-09-26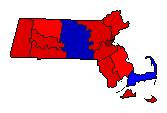
| Barnstable | Galvin | 46.5% | |
| Chase | 49.9% | |
| Other | 3.6% | |
| Berkshire | Galvin | 53.4% | |
| Chase | 41.8% | |
| Other | 4.8% | |
| Bristol | Galvin | 59.1% | |
| Chase | 36.4% | |
| Other | 4.5% | |
| Dukes | Galvin | 56.2% | |
| Chase | 38.7% | |
| Other | 5.1% | |
| Essex | Galvin | 55.5% | |
| Chase | 40.9% | |
| Other | 3.6% | |
| Franklin | Galvin | 48.5% | |
| Chase | 47.0% | |
| Other | 4.5% | |
| Hampden | Galvin | 50.8% | |
| Chase | 46.1% | |
| Other | 3.1% | |
| Hampshire | Galvin | 57.6% | |
| Chase | 38.8% | |
| Other | 3.6% | |
| Middlesex | Galvin | 59.0% | |
| Chase | 37.3% | |
| Other | 3.7% | |
| Nantucket | Galvin | 50.5% | |
| Chase | 46.0% | |
| Other | 3.5% | |
| Norfolk | Galvin | 58.7% | |
| Chase | 37.1% | |
| Other | 4.2% | |
| Plymouth | Galvin | 49.4% | |
| Chase | 42.7% | |
| Other | 7.9% | |
| Suffolk | Galvin | 73.2% | |
| Chase | 23.0% | |
| Other | 3.8% | |
| Worcester | Galvin | 36.1% | |
| Chase | 61.6% | |
| Other | 2.3% | |