1994 State Treasurer General Election Data Graphs - Massachusetts
by CountyData for this Contest was Contributed by on 2016-09-26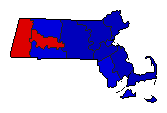
| Barnstable | O'Brien | 27.0% | |
| Malone | 69.4% | |
| Other | 3.6% | |
| Berkshire | O'Brien | 50.8% | |
| Malone | 44.4% | |
| Other | 4.8% | |
| Bristol | O'Brien | 38.4% | |
| Malone | 55.4% | |
| Other | 6.1% | |
| Dukes | O'Brien | 40.2% | |
| Malone | 54.2% | |
| Other | 5.6% | |
| Essex | O'Brien | 27.5% | |
| Malone | 65.9% | |
| Other | 6.7% | |
| Franklin | O'Brien | 39.0% | |
| Malone | 57.1% | |
| Other | 4.0% | |
| Hampden | O'Brien | 42.8% | |
| Malone | 53.6% | |
| Other | 3.7% | |
| Hampshire | O'Brien | 55.3% | |
| Malone | 42.0% | |
| Other | 2.7% | |
| Middlesex | O'Brien | 29.8% | |
| Malone | 65.0% | |
| Other | 5.1% | |
| Nantucket | O'Brien | 35.2% | |
| Malone | 61.2% | |
| Other | 3.6% | |
| Norfolk | O'Brien | 28.6% | |
| Malone | 67.3% | |
| Other | 4.1% | |
| Plymouth | O'Brien | 26.4% | |
| Malone | 69.4% | |
| Other | 4.3% | |
| Suffolk | O'Brien | 35.3% | |
| Malone | 57.1% | |
| Other | 7.6% | |
| Worcester | O'Brien | 28.1% | |
| Malone | 67.7% | |
| Other | 4.2% | |