1996 Presidential General Election Data Graphs - New Hampshire
by County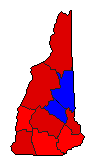
| Belknap | Clinton | 43.8% | |
| Dole | 45.2% | |
| Perot | 9.7% | |
| Other | 1.2% | |
| Carroll | Clinton | 42.8% | |
| Dole | 44.2% | |
| Perot | 11.8% | |
| Other | 1.3% | |
| Cheshire | Clinton | 54.4% | |
| Dole | 34.5% | |
| Perot | 9.3% | |
| Other | 1.7% | |
| Coos | Clinton | 50.9% | |
| Dole | 33.3% | |
| Perot | 14.7% | |
| Other | 1.1% | |
| Grafton | Clinton | 50.3% | |
| Dole | 38.9% | |
| Perot | 9.3% | |
| Other | 1.5% | |
| Hillsborough | Clinton | 48.6% | |
| Dole | 40.5% | |
| Perot | 9.1% | |
| Other | 1.7% | |
| Merrimack | Clinton | 52.3% | |
| Dole | 37.8% | |
| Perot | 8.6% | |
| Other | 1.4% | |
| Rockingham | Clinton | 47.4% | |
| Dole | 40.8% | |
| Perot | 10.1% | |
| Other | 1.7% | |
| Strafford | Clinton | 54.8% | |
| Dole | 33.8% | |
| Perot | 9.5% | |
| Other | 1.9% | |
| Sullivan | Clinton | 48.6% | |
| Dole | 39.5% | |
| Perot | 10.4% | |
| Other | 1.5% | |