1996 Senatorial General Election Data Graphs - North Carolina
Note: The Google advertisement links below may advocate political positions that this site does not endorse.
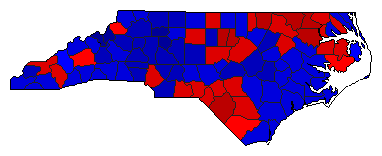
Map

AlamanceGantt38.4%
 
Helms60.0%
 
Other1.6%


AlexanderGantt34.1%
 
Helms64.3%
 
Other1.5%


AlleghanyGantt42.6%
 
Helms55.8%
 
Other1.6%


AnsonGantt57.9%
 
Helms41.1%
 
Other1.0%


AsheGantt38.7%
 
Helms59.7%
 
Other1.5%


AveryGantt28.4%
 
Helms70.1%
 
Other1.5%


BeaufortGantt39.4%
 
Helms59.3%
 
Other1.3%


BertieGantt62.3%
 
Helms37.1%
 
Other0.6%


BladenGantt51.8%
 
Helms47.2%
 
Other0.9%


BrunswickGantt45.9%
 
Helms51.9%
 
Other2.2%


BuncombeGantt49.9%
 
Helms48.3%
 
Other1.8%


BurkeGantt41.3%
 
Helms56.6%
 
Other2.1%


CabarrusGantt37.2%
 
Helms60.9%
 
Other1.8%


CaldwellGantt35.4%
 
Helms62.9%
 
Other1.7%


CamdenGantt41.9%
 
Helms56.5%
 
Other1.6%


CarteretGantt38.7%
 
Helms59.3%
 
Other1.9%


CaswellGantt50.7%
 
Helms48.5%
 
Other0.8%


CatawbaGantt36.1%
 
Helms62.2%
 
Other1.7%


ChathamGantt52.0%
 
Helms46.5%
 
Other1.5%


CherokeeGantt43.1%
 
Helms55.8%
 
Other1.1%


ChowanGantt51.3%
 
Helms46.5%
 
Other2.2%


ClayGantt45.0%
 
Helms53.3%
 
Other1.7%


ClevelandGantt44.5%
 
Helms54.1%
 
Other1.4%


ColumbusGantt49.4%
 
Helms49.3%
 
Other1.2%


CravenGantt43.4%
 
Helms55.7%
 
Other0.9%


CumberlandGantt51.3%
 
Helms47.2%
 
Other1.5%


CurrituckGantt39.7%
 
Helms58.8%
 
Other1.5%


DareGantt49.1%
 
Helms49.4%
 
Other1.5%


DavidsonGantt31.2%
 
Helms67.1%
 
Other1.8%


DavieGantt28.2%
 
Helms70.2%
 
Other1.6%


DuplinGantt46.0%
 
Helms53.0%
 
Other1.0%


DurhamGantt64.1%
 
Helms34.8%
 
Other1.1%


EdgecombeGantt57.0%
 
Helms42.3%
 
Other0.7%


ForsythGantt45.2%
 
Helms53.3%
 
Other1.5%


FranklinGantt45.9%
 
Helms53.0%
 
Other1.1%


GastonGantt35.4%
 
Helms63.1%
 
Other1.5%


GatesGantt56.8%
 
Helms42.6%
 
Other0.6%


GrahamGantt37.2%
 
Helms61.9%
 
Other0.9%


GranvilleGantt48.4%
 
Helms50.7%
 
Other0.9%


GreeneGantt39.3%
 
Helms59.8%
 
Other0.9%


GuilfordGantt50.6%
 
Helms47.9%
 
Other1.5%


HalifaxGantt55.2%
 
Helms44.0%
 
Other0.8%


HarnettGantt37.5%
 
Helms61.4%
 
Other1.1%


HaywoodGantt48.3%
 
Helms49.8%
 
Other1.9%


HendersonGantt38.2%
 
Helms59.7%
 
Other2.0%


HertfordGantt65.1%
 
Helms34.4%
 
Other0.5%


HokeGantt59.0%
 
Helms39.1%
 
Other2.0%


HydeGantt49.7%
 
Helms49.1%
 
Other1.2%


IredellGantt36.8%
 
Helms61.3%
 
Other1.9%


JacksonGantt54.1%
 
Helms44.6%
 
Other1.4%


JohnstonGantt33.0%
 
Helms65.9%
 
Other1.1%


JonesGantt47.1%
 
Helms52.0%
 
Other0.9%


LeeGantt41.7%
 
Helms57.1%
 
Other1.2%


LenoirGantt44.2%
 
Helms55.2%
 
Other0.5%


LincolnGantt37.2%
 
Helms61.0%
 
Other1.8%


McDowellGantt37.4%
 
Helms60.8%
 
Other1.9%


MaconGantt41.2%
 
Helms56.4%
 
Other2.4%


MadisonGantt48.7%
 
Helms50.0%
 
Other1.2%


MartinGantt47.0%
 
Helms52.4%
 
Other0.6%


MecklenburgGantt54.5%
 
Helms44.2%
 
Other1.3%


MitchellGantt25.5%
 
Helms72.9%
 
Other1.6%


MontgomeryGantt45.5%
 
Helms52.8%
 
Other1.8%


MooreGantt40.5%
 
Helms58.3%
 
Other1.2%


NashGantt37.5%
 
Helms61.6%
 
Other0.9%


New HanoverGantt47.0%
 
Helms50.9%
 
Other2.1%


NorthamptonGantt63.9%
 
Helms35.5%
 
Other0.6%


OnslowGantt39.7%
 
Helms58.2%
 
Other2.1%


OrangeGantt67.6%
 
Helms31.0%
 
Other1.4%


PamlicoGantt46.2%
 
Helms52.5%
 
Other1.3%


PasquotankGantt52.8%
 
Helms45.9%
 
Other1.3%


PenderGantt46.4%
 
Helms51.9%
 
Other1.7%


PerquimansGantt48.0%
 
Helms50.9%
 
Other1.2%


PersonGantt41.1%
 
Helms58.1%
 
Other0.8%


PittGantt47.6%
 
Helms51.4%
 
Other1.0%


PolkGantt45.7%
 
Helms52.6%
 
Other1.8%


RandolphGantt29.1%
 
Helms69.1%
 
Other1.8%


RichmondGantt53.3%
 
Helms44.8%
 
Other1.9%


RobesonGantt61.8%
 
Helms37.2%
 
Other1.1%


RockinghamGantt40.4%
 
Helms58.1%
 
Other1.5%


RowanGantt37.1%
 
Helms60.7%
 
Other2.2%


RutherfordGantt39.2%
 
Helms58.9%
 
Other2.0%


SampsonGantt45.0%
 
Helms54.3%
 
Other0.7%


ScotlandGantt56.9%
 
Helms41.8%
 
Other1.2%


StanlyGantt34.6%
 
Helms63.7%
 
Other1.7%


StokesGantt31.1%
 
Helms67.5%
 
Other1.4%


SurryGantt37.6%
 
Helms61.2%
 
Other1.3%


SwainGantt52.1%
 
Helms46.4%
 
Other1.5%


TransylvaniaGantt44.1%
 
Helms53.3%
 
Other2.6%


TyrrellGantt51.9%
 
Helms47.3%
 
Other0.9%


UnionGantt34.6%
 
Helms64.1%
 
Other1.3%


VanceGantt52.1%
 
Helms47.2%
 
Other0.6%


WakeGantt50.6%
 
Helms48.2%
 
Other1.2%


WarrenGantt61.8%
 
Helms37.5%
 
Other0.7%


WashingtonGantt52.6%
 
Helms46.4%
 
Other1.0%


WataugaGantt49.0%
 
Helms48.6%
 
Other2.3%


WayneGantt39.2%
 
Helms60.2%
 
Other0.6%


WilkesGantt32.5%
 
Helms65.9%
 
Other1.6%


WilsonGantt45.2%
 
Helms54.2%
 
Other0.7%


YadkinGantt23.4%
 
Helms75.0%
 
Other1.6%


YanceyGantt46.8%
 
Helms52.1%
 
Other1.1%


National DataGraph for 1996 - North Carolina Results for 1996

Login

Terms of Use - DCMA Policy - Privacy Policy and Cookies


© Dave Leip's Atlas of U.S. Elections, LLC 2019 All Rights Reserved