1996 Gubernatorial Republican Primary Election Data Graphs - Washington
Note: The Google advertisement links below may advocate political positions that this site does not endorse.
Data for this Contest was Contributed by on 2010-07-30
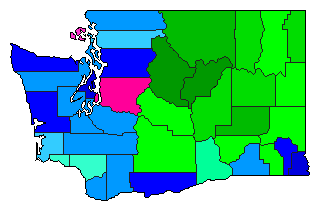
Map

AdamsMaleng4.4%
 
Craswell20.1%
 
Foreman62.4%
 
Other13.2%


AsotinMaleng3.3%
 
Craswell58.9%
 
Foreman23.7%
 
Other14.1%


BentonMaleng8.6%
 
Craswell34.9%
 
Foreman38.0%
 
Other18.6%


ChelanMaleng2.9%
 
Craswell13.4%
 
Foreman77.5%
 
Other6.2%


ClallamMaleng15.2%
 
Craswell40.7%
 
Foreman25.7%
 
Other18.4%


ClarkMaleng9.7%
 
Craswell38.5%
 
Foreman20.2%
 
Other31.6%


ColumbiaMaleng4.1%
 
Craswell35.2%
 
Foreman45.6%
 
Other15.2%


CowlitzMaleng15.5%
 
Craswell26.5%
 
Foreman29.9%
 
Other28.1%


DouglasMaleng2.6%
 
Craswell13.6%
 
Foreman79.2%
 
Other4.6%


FerryMaleng4.0%
 
Craswell30.0%
 
Foreman53.7%
 
Other12.4%


FranklinMaleng7.1%
 
Craswell29.6%
 
Foreman49.3%
 
Other14.0%


GarfieldMaleng7.2%
 
Craswell43.7%
 
Foreman36.7%
 
Other12.4%


GrantMaleng4.7%
 
Craswell26.0%
 
Foreman56.6%
 
Other12.6%


Grays HarborMaleng17.6%
 
Craswell42.8%
 
Foreman22.1%
 
Other17.5%


IslandMaleng21.9%
 
Craswell33.1%
 
Foreman28.6%
 
Other16.4%


JeffersonMaleng22.4%
 
Craswell33.4%
 
Foreman20.9%
 
Other23.2%


KingMaleng30.1%
 
Craswell27.7%
 
Foreman19.9%
 
Other22.3%


KitsapMaleng14.9%
 
Craswell53.4%
 
Foreman15.5%
 
Other16.2%


KittitasMaleng8.5%
 
Craswell24.2%
 
Foreman45.9%
 
Other21.4%


KlickitatMaleng6.8%
 
Craswell48.7%
 
Foreman27.8%
 
Other16.7%


LewisMaleng18.7%
 
Craswell37.2%
 
Foreman28.1%
 
Other16.0%


LincolnMaleng4.4%
 
Craswell21.2%
 
Foreman57.5%
 
Other17.0%


MasonMaleng18.2%
 
Craswell34.8%
 
Foreman25.3%
 
Other21.7%


OkanoganMaleng3.5%
 
Craswell19.1%
 
Foreman69.7%
 
Other7.7%


PacificMaleng24.1%
 
Craswell25.1%
 
Foreman23.5%
 
Other27.3%


Pend OreilleMaleng5.4%
 
Craswell20.5%
 
Foreman55.3%
 
Other18.8%


PierceMaleng22.0%
 
Craswell32.7%
 
Foreman21.7%
 
Other23.6%


San JuanMaleng26.7%
 
Craswell20.2%
 
Foreman23.4%
 
Other29.8%


SkagitMaleng21.8%
 
Craswell29.3%
 
Foreman23.7%
 
Other25.2%


SkamaniaMaleng14.4%
 
Craswell34.7%
 
Foreman27.7%
 
Other23.3%


SnohomishMaleng19.5%
 
Craswell42.1%
 
Foreman21.0%
 
Other17.5%


SpokaneMaleng5.2%
 
Craswell20.7%
 
Foreman42.8%
 
Other31.3%


StevensMaleng4.2%
 
Craswell27.8%
 
Foreman49.1%
 
Other18.8%


ThurstonMaleng18.4%
 
Craswell36.5%
 
Foreman20.8%
 
Other24.2%


WahkiakumMaleng20.0%
 
Craswell26.5%
 
Foreman27.1%
 
Other26.5%


Walla WallaMaleng7.5%
 
Craswell36.1%
 
Foreman36.0%
 
Other20.4%


WhatcomMaleng27.4%
 
Craswell35.5%
 
Foreman19.6%
 
Other17.5%


WhitmanMaleng5.5%
 
Craswell20.0%
 
Foreman47.7%
 
Other26.8%


YakimaMaleng5.8%
 
Craswell28.6%
 
Foreman48.2%
 
Other17.4%


National DataGraph for 1996 - Washington Results for 1996

Login

Terms of Use - DCMA Policy - Privacy Policy and Cookies


© Dave Leip's Atlas of U.S. Elections, LLC 2019 All Rights Reserved