1998 Comptroller General General Election Data Graphs - South Carolina
Note: The Google advertisement links below may advocate political positions that this site does not endorse.
Data for this Contest was Contributed by on 2007-01-02
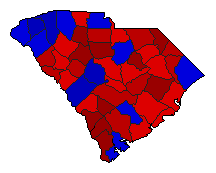
Map

AbbevilleLander66.7%
 
Courson33.3%


AikenLander38.6%
 
Courson61.4%


AllendaleLander79.3%
 
Courson20.7%


AndersonLander46.0%
 
Courson54.0%
 
Other0.0%


BambergLander72.4%
 
Courson27.6%


BarnwellLander54.5%
 
Courson45.5%


BeaufortLander41.0%
 
Courson58.8%
 
Other0.1%


BerkeleyLander51.0%
 
Courson49.0%
 
Other0.0%


CalhounLander57.1%
 
Courson42.8%
 
Other0.1%


CharlestonLander53.4%
 
Courson46.6%
 
Other0.0%


CherokeeLander52.0%
 
Courson48.0%


ChesterLander66.0%
 
Courson34.0%


ChesterfieldLander61.2%
 
Courson38.7%
 
Other0.1%


ClarendonLander67.9%
 
Courson32.1%
 
Other0.0%


ColletonLander60.9%
 
Courson39.1%
 
Other0.0%


DarlingtonLander53.8%
 
Courson46.2%
 
Other0.0%


DillonLander66.3%
 
Courson33.6%
 
Other0.0%


DorchesterLander47.0%
 
Courson53.0%
 
Other0.0%


EdgefieldLander56.1%
 
Courson43.9%


FairfieldLander70.7%
 
Courson29.3%
 
Other0.0%


FlorenceLander50.7%
 
Courson49.2%
 
Other0.1%


GeorgetownLander56.1%
 
Courson43.9%


GreenvilleLander37.6%
 
Courson62.3%
 
Other0.1%


GreenwoodLander55.0%
 
Courson45.0%
 
Other0.0%


HamptonLander76.2%
 
Courson23.8%
 
Other0.0%


HorryLander46.2%
 
Courson53.8%
 
Other0.0%


JasperLander70.5%
 
Courson29.5%


KershawLander47.5%
 
Courson51.8%
 
Other0.8%


LancasterLander58.5%
 
Courson41.5%
 
Other0.0%


LaurensLander55.6%
 
Courson44.4%
 
Other0.0%


LeeLander72.7%
 
Courson27.3%
 
Other0.0%


LexingtonLander36.8%
 
Courson63.2%
 
Other0.0%


McCormickLander64.4%
 
Courson35.6%


MarionLander68.9%
 
Courson31.1%


MarlboroLander74.4%
 
Courson25.5%
 
Other0.0%


NewberryLander72.0%
 
Courson28.0%
 
Other0.0%


OconeeLander44.2%
 
Courson55.8%


OrangeburgLander69.5%
 
Courson30.5%
 
Other0.1%


PickensLander35.4%
 
Courson64.6%
 
Other0.0%


RichlandLander55.7%
 
Courson44.3%
 
Other0.0%


SaludaLander68.6%
 
Courson31.3%
 
Other0.1%


SpartanburgLander42.8%
 
Courson57.2%
 
Other0.0%


SumterLander57.0%
 
Courson43.0%


UnionLander71.3%
 
Courson28.7%
 
Other0.0%


WilliamsburgLander71.3%
 
Courson28.7%
 
Other0.1%


YorkLander42.6%
 
Courson57.4%
 
Other0.0%


National DataGraph for 1998 - South Carolina Results for 1998

Login

Terms of Use - DCMA Policy - Privacy Policy and Cookies


© Dave Leip's Atlas of U.S. Elections, LLC 2019 All Rights Reserved