1998 Senatorial General Election Data Graphs - South Carolina
Note: The Google advertisement links below may advocate political positions that this site does not endorse.
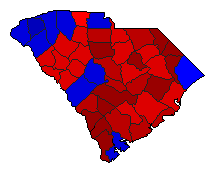
Map

AbbevilleHollings59.1%
 
Inglis39.3%
 
Other1.6%


AikenHollings42.4%
 
Inglis56.1%
 
Other1.5%


AllendaleHollings79.8%
 
Inglis19.5%
 
Other0.7%


AndersonHollings45.5%
 
Inglis52.6%
 
Other2.0%


BambergHollings78.2%
 
Inglis20.8%
 
Other1.0%


BarnwellHollings63.0%
 
Inglis35.6%
 
Other1.5%


BeaufortHollings47.4%
 
Inglis51.4%
 
Other1.2%


BerkeleyHollings54.5%
 
Inglis43.4%
 
Other2.0%


CalhounHollings61.2%
 
Inglis36.9%
 
Other1.9%


CharlestonHollings60.2%
 
Inglis38.0%
 
Other1.8%


CherokeeHollings49.5%
 
Inglis48.5%
 
Other2.0%


ChesterHollings64.1%
 
Inglis34.2%
 
Other1.8%


ChesterfieldHollings64.5%
 
Inglis34.4%
 
Other1.1%


ClarendonHollings69.3%
 
Inglis29.9%
 
Other0.8%


ColletonHollings62.8%
 
Inglis35.6%
 
Other1.6%


DarlingtonHollings58.7%
 
Inglis40.1%
 
Other1.2%


DillonHollings70.9%
 
Inglis27.6%
 
Other1.6%


DorchesterHollings50.9%
 
Inglis47.4%
 
Other1.7%


EdgefieldHollings57.4%
 
Inglis41.4%
 
Other1.2%


FairfieldHollings71.8%
 
Inglis26.5%
 
Other1.7%


FlorenceHollings56.0%
 
Inglis42.8%
 
Other1.3%


GeorgetownHollings58.0%
 
Inglis40.8%
 
Other1.2%


GreenvilleHollings38.8%
 
Inglis59.8%
 
Other1.4%


GreenwoodHollings50.2%
 
Inglis48.3%
 
Other1.4%


HamptonHollings79.2%
 
Inglis19.5%
 
Other1.3%


HorryHollings48.5%
 
Inglis48.7%
 
Other2.8%


JasperHollings74.1%
 
Inglis24.4%
 
Other1.5%


KershawHollings51.5%
 
Inglis46.3%
 
Other2.2%


LancasterHollings58.0%
 
Inglis40.7%
 
Other1.3%


LaurensHollings53.0%
 
Inglis45.2%
 
Other1.8%


LeeHollings73.6%
 
Inglis25.1%
 
Other1.2%


LexingtonHollings41.4%
 
Inglis56.8%
 
Other1.8%


McCormickHollings58.4%
 
Inglis40.0%
 
Other1.7%


MarionHollings72.3%
 
Inglis26.5%
 
Other1.2%


MarlboroHollings76.4%
 
Inglis22.2%
 
Other1.4%


NewberryHollings53.9%
 
Inglis43.8%
 
Other2.2%


OconeeHollings42.2%
 
Inglis55.4%
 
Other2.4%


OrangeburgHollings72.0%
 
Inglis27.0%
 
Other1.0%


PickensHollings36.2%
 
Inglis62.0%
 
Other1.8%


RichlandHollings62.7%
 
Inglis35.8%
 
Other1.5%


SaludaHollings56.8%
 
Inglis41.8%
 
Other1.5%


SpartanburgHollings44.0%
 
Inglis54.1%
 
Other1.9%


SumterHollings59.1%
 
Inglis39.6%
 
Other1.4%


UnionHollings53.7%
 
Inglis45.0%
 
Other1.4%


WilliamsburgHollings74.2%
 
Inglis24.4%
 
Other1.3%


YorkHollings45.4%
 
Inglis53.3%
 
Other1.3%


National DataGraph for 1998 - South Carolina Results for 1998

Login

Terms of Use - DCMA Policy - Privacy Policy and Cookies


© Dave Leip's Atlas of U.S. Elections, LLC 2019 All Rights Reserved