1998 Secretary of State Republican Primary Election Data Graphs - Wyoming
Note: The Google advertisement links below may advocate political positions that this site does not endorse.
Data for this Contest was Contributed by on 2007-05-14
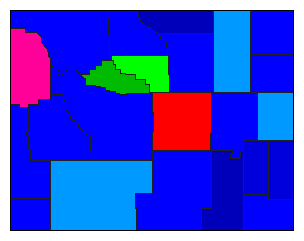
Map

AlbanyBurton16.8%
 
Meyer65.8%
 
Quarberg17.4%


Big HornBurton16.9%
 
Meyer45.6%
 
Quarberg37.4%


CampbellBurton26.8%
 
Meyer37.0%
 
Quarberg36.2%


CarbonBurton27.2%
 
Meyer45.4%
 
Quarberg27.4%


ConverseBurton29.0%
 
Meyer49.9%
 
Quarberg21.1%


CrookBurton28.2%
 
Meyer41.4%
 
Quarberg30.4%


FremontBurton25.4%
 
Meyer47.3%
 
Quarberg27.3%


GoshenBurton16.1%
 
Meyer57.5%
 
Quarberg26.3%


Hot SpringsBurton15.9%
 
Meyer17.2%
 
Quarberg66.9%


JohnsonBurton27.6%
 
Meyer49.8%
 
Quarberg22.6%


LaramieBurton30.7%
 
Meyer46.3%
 
Quarberg23.0%


LincolnBurton29.8%
 
Meyer40.2%
 
Quarberg30.0%


NatronaBurton46.4%
 
Meyer40.0%
 
Quarberg13.7%


NiobraraBurton25.7%
 
Meyer38.7%
 
Quarberg35.6%


ParkBurton24.4%
 
Meyer49.3%
 
Quarberg26.4%


PlatteBurton22.8%
 
Meyer55.9%
 
Quarberg21.3%


SheridanBurton21.9%
 
Meyer61.3%
 
Quarberg16.7%


SubletteBurton22.2%
 
Meyer42.2%
 
Quarberg35.5%


SweetwaterBurton28.8%
 
Meyer39.5%
 
Quarberg31.7%


TetonBurton37.2%
 
Meyer35.5%
 
Quarberg27.3%


UintaBurton31.6%
 
Meyer42.0%
 
Quarberg26.5%


WashakieBurton21.3%
 
Meyer28.9%
 
Quarberg49.7%


WestonBurton30.5%
 
Meyer41.7%
 
Quarberg27.8%


National DataGraph for 1998 - Wyoming Results for 1998

Login

Terms of Use - DCMA Policy - Privacy Policy and Cookies


© Dave Leip's Atlas of U.S. Elections, LLC 2019 All Rights Reserved