1998 Senatorial General Election Data Graphs - California
Note: The Google advertisement links below may advocate political positions that this site does not endorse.
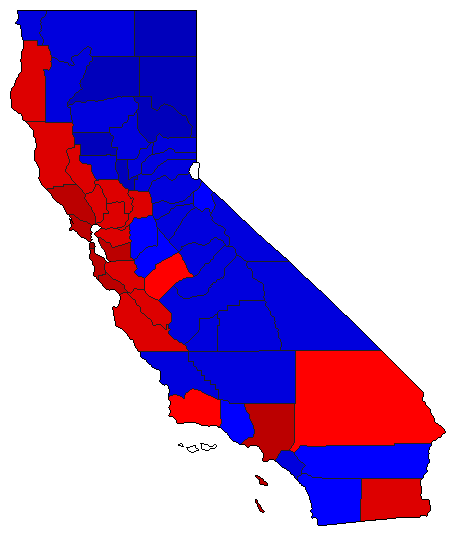
Map

AlamedaBoxer69.6%
 
Fong27.4%
 
Other3.0%


AlpineBoxer45.9%
 
Fong49.2%
 
Other5.0%


AmadorBoxer42.2%
 
Fong54.1%
 
Other3.7%


ButteBoxer40.7%
 
Fong53.9%
 
Other5.4%


CalaverasBoxer41.4%
 
Fong53.0%
 
Other5.5%


ColusaBoxer37.1%
 
Fong59.0%
 
Other4.0%


Contra CostaBoxer57.5%
 
Fong39.3%
 
Other3.2%


Del NorteBoxer41.8%
 
Fong52.8%
 
Other5.4%


El DoradoBoxer38.5%
 
Fong57.5%
 
Other4.0%


FresnoBoxer44.3%
 
Fong51.8%
 
Other3.9%


GlennBoxer32.0%
 
Fong62.5%
 
Other5.6%


HumboldtBoxer50.6%
 
Fong44.2%
 
Other5.2%


ImperialBoxer51.5%
 
Fong41.5%
 
Other7.1%


InyoBoxer37.3%
 
Fong57.4%
 
Other5.4%


KernBoxer36.6%
 
Fong59.3%
 
Other4.2%


KingsBoxer42.8%
 
Fong52.9%
 
Other4.4%


LakeBoxer54.8%
 
Fong40.2%
 
Other5.0%


LassenBoxer32.9%
 
Fong60.3%
 
Other6.7%


Los AngelesBoxer60.8%
 
Fong35.8%
 
Other3.4%


MaderaBoxer37.5%
 
Fong58.1%
 
Other4.3%


MarinBoxer65.4%
 
Fong31.8%
 
Other2.8%


MariposaBoxer38.2%
 
Fong56.1%
 
Other5.7%


MendocinoBoxer57.7%
 
Fong35.8%
 
Other6.4%


MercedBoxer48.4%
 
Fong47.4%
 
Other4.2%


ModocBoxer31.8%
 
Fong61.0%
 
Other7.2%


MonoBoxer42.8%
 
Fong52.5%
 
Other4.7%


MontereyBoxer53.2%
 
Fong42.6%
 
Other4.2%


NapaBoxer54.5%
 
Fong41.0%
 
Other4.5%


NevadaBoxer41.2%
 
Fong54.9%
 
Other3.9%


OrangeBoxer39.1%
 
Fong56.8%
 
Other4.2%


PlacerBoxer38.6%
 
Fong57.7%
 
Other3.7%


PlumasBoxer33.1%
 
Fong61.5%
 
Other5.4%


RiversideBoxer45.8%
 
Fong49.6%
 
Other4.6%


SacramentoBoxer50.5%
 
Fong45.9%
 
Other3.7%


San BenitoBoxer51.1%
 
Fong44.0%
 
Other4.9%


San BernardinoBoxer47.5%
 
Fong47.3%
 
Other5.2%


San DiegoBoxer46.2%
 
Fong49.2%
 
Other4.6%


San FranciscoBoxer75.2%
 
Fong21.9%
 
Other2.8%


San JoaquinBoxer48.0%
 
Fong48.1%
 
Other3.9%


San Luis ObispoBoxer44.2%
 
Fong51.9%
 
Other3.9%


San MateoBoxer63.1%
 
Fong33.9%
 
Other3.0%


Santa BarbaraBoxer49.4%
 
Fong46.9%
 
Other3.7%


Santa ClaraBoxer57.8%
 
Fong38.2%
 
Other4.0%


Santa CruzBoxer62.7%
 
Fong32.1%
 
Other5.2%


ShastaBoxer34.0%
 
Fong60.0%
 
Other6.0%


SierraBoxer34.4%
 
Fong59.5%
 
Other6.1%


SiskiyouBoxer39.2%
 
Fong55.2%
 
Other5.6%


SolanoBoxer56.3%
 
Fong39.7%
 
Other4.0%


SonomaBoxer61.1%
 
Fong34.1%
 
Other4.7%


StanislausBoxer47.4%
 
Fong48.7%
 
Other3.9%


SutterBoxer35.6%
 
Fong60.8%
 
Other3.6%


TehamaBoxer37.0%
 
Fong56.7%
 
Other6.3%


TrinityBoxer39.3%
 
Fong52.1%
 
Other8.7%


TulareBoxer39.2%
 
Fong57.0%
 
Other3.9%


TuolumneBoxer43.7%
 
Fong51.4%
 
Other4.8%


VenturaBoxer46.9%
 
Fong48.9%
 
Other4.2%


YoloBoxer58.1%
 
Fong38.1%
 
Other3.8%


YubaBoxer41.0%
 
Fong53.4%
 
Other5.6%


National DataGraph for 1998 - California Results for 1998

Login

Terms of Use - DCMA Policy - Privacy Policy and Cookies


© Dave Leip's Atlas of U.S. Elections, LLC 2019 All Rights Reserved