2000 Presidential General Election Data Graphs - Iowa
by County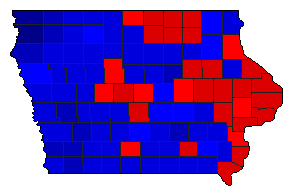
| Adair | Gore | 42.5% | |
| Bush | 55.2% | |
| Nader | 1.6% | |
| Other | 0.7% | |
| Adams | Gore | 41.8% | |
| Bush | 54.5% | |
| Nader | 2.4% | |
| Other | 1.3% | |
| Allamakee | Gore | 44.6% | |
| Bush | 50.7% | |
| Nader | 3.1% | |
| Other | 1.6% | |
| Appanoose | Gore | 44.9% | |
| Bush | 52.5% | |
| Nader | 1.8% | |
| Other | 0.8% | |
| Audubon | Gore | 47.0% | |
| Bush | 50.4% | |
| Nader | 1.5% | |
| Other | 1.0% | |
| Benton | Gore | 50.3% | |
| Bush | 46.5% | |
| Nader | 2.0% | |
| Other | 1.3% | |
| Black Hawk | Gore | 54.7% | |
| Bush | 42.6% | |
| Nader | 2.1% | |
| Other | 0.7% | |
| Boone | Gore | 51.2% | |
| Bush | 45.9% | |
| Nader | 2.1% | |
| Other | 0.8% | |
| Bremer | Gore | 46.3% | |
| Bush | 50.8% | |
| Nader | 2.3% | |
| Other | 0.6% | |
| Buchanan | Gore | 53.6% | |
| Bush | 43.5% | |
| Nader | 1.8% | |
| Other | 1.1% | |
| Buena Vista | Gore | 41.3% | |
| Bush | 54.6% | |
| Nader | 2.8% | |
| Other | 1.2% | |
| Butler | Gore | 40.7% | |
| Bush | 57.1% | |
| Nader | 1.7% | |
| Other | 0.6% | |
| Calhoun | Gore | 42.3% | |
| Bush | 55.1% | |
| Nader | 1.8% | |
| Other | 0.8% | |
| Carroll | Gore | 46.6% | |
| Bush | 51.0% | |
| Nader | 1.5% | |
| Other | 0.8% | |
| Cass | Gore | 36.1% | |
| Bush | 61.1% | |
| Nader | 2.1% | |
| Other | 0.7% | |
| Cedar | Gore | 48.3% | |
| Bush | 48.3% | |
| Nader | 2.5% | |
| Other | 0.8% | |
| Cerro Gordo | Gore | 55.0% | |
| Bush | 42.4% | |
| Nader | 1.8% | |
| Other | 0.8% | |
| Cherokee | Gore | 43.2% | |
| Bush | 52.5% | |
| Nader | 2.4% | |
| Other | 1.9% | |
| Chickasaw | Gore | 52.2% | |
| Bush | 44.6% | |
| Nader | 2.2% | |
| Other | 1.0% | |
| Clarke | Gore | 49.8% | |
| Bush | 47.5% | |
| Nader | 1.8% | |
| Other | 0.9% | |
| Clay | Gore | 43.5% | |
| Bush | 52.7% | |
| Nader | 2.2% | |
| Other | 1.7% | |
| Clayton | Gore | 49.4% | |
| Bush | 47.1% | |
| Nader | 2.4% | |
| Other | 1.1% | |
| Clinton | Gore | 55.3% | |
| Bush | 41.6% | |
| Nader | 2.1% | |
| Other | 0.9% | |
| Crawford | Gore | 43.3% | |
| Bush | 53.1% | |
| Nader | 2.2% | |
| Other | 1.4% | |
| Dallas | Gore | 44.3% | |
| Bush | 53.3% | |
| Nader | 1.7% | |
| Other | 0.7% | |
| Davis | Gore | 45.0% | |
| Bush | 52.0% | |
| Nader | 1.8% | |
| Other | 1.2% | |
| Decatur | Gore | 45.1% | |
| Bush | 51.3% | |
| Nader | 2.5% | |
| Other | 1.0% | |
| Delaware | Gore | 45.6% | |
| Bush | 51.2% | |
| Nader | 1.9% | |
| Other | 1.3% | |
| Des Moines | Gore | 58.6% | |
| Bush | 38.1% | |
| Nader | 2.1% | |
| Other | 1.1% | |
| Dickinson | Gore | 45.1% | |
| Bush | 52.0% | |
| Nader | 2.1% | |
| Other | 0.8% | |
| Dubuque | Gore | 55.4% | |
| Bush | 40.8% | |
| Nader | 2.4% | |
| Other | 1.3% | |
| Emmet | Gore | 46.8% | |
| Bush | 50.3% | |
| Nader | 2.1% | |
| Other | 0.8% | |
| Fayette | Gore | 48.2% | |
| Bush | 49.3% | |
| Nader | 1.8% | |
| Other | 0.6% | |
| Floyd | Gore | 52.9% | |
| Bush | 44.1% | |
| Nader | 2.1% | |
| Other | 0.9% | |
| Franklin | Gore | 43.0% | |
| Bush | 53.8% | |
| Nader | 2.2% | |
| Other | 1.0% | |
| Fremont | Gore | 40.3% | |
| Bush | 57.2% | |
| Nader | 1.7% | |
| Other | 0.7% | |
| Greene | Gore | 48.8% | |
| Bush | 48.4% | |
| Nader | 2.2% | |
| Other | 0.6% | |
| Grundy | Gore | 35.0% | |
| Bush | 63.0% | |
| Nader | 1.1% | |
| Other | 0.8% | |
| Guthrie | Gore | 45.6% | |
| Bush | 51.9% | |
| Nader | 1.6% | |
| Other | 0.9% | |
| Hamilton | Gore | 45.0% | |
| Bush | 52.4% | |
| Nader | 1.9% | |
| Other | 0.8% | |
| Hancock | Gore | 41.9% | |
| Bush | 54.9% | |
| Nader | 2.3% | |
| Other | 0.8% | |
| Hardin | Gore | 44.3% | |
| Bush | 53.2% | |
| Nader | 1.7% | |
| Other | 0.9% | |
| Harrison | Gore | 39.0% | |
| Bush | 58.1% | |
| Nader | 1.9% | |
| Other | 1.0% | |
| Henry | Gore | 45.1% | |
| Bush | 51.6% | |
| Nader | 2.1% | |
| Other | 1.2% | |
| Howard | Gore | 54.0% | |
| Bush | 42.8% | |
| Nader | 2.2% | |
| Other | 1.0% | |
| Humboldt | Gore | 39.5% | |
| Bush | 57.6% | |
| Nader | 2.0% | |
| Other | 0.9% | |
| Ida | Gore | 40.4% | |
| Bush | 56.4% | |
| Nader | 1.7% | |
| Other | 1.5% | |
| Iowa | Gore | 43.6% | |
| Bush | 52.5% | |
| Nader | 2.5% | |
| Other | 1.4% | |
| Jackson | Gore | 54.7% | |
| Bush | 41.7% | |
| Nader | 2.5% | |
| Other | 1.0% | |
| Jasper | Gore | 48.8% | |
| Bush | 48.9% | |
| Nader | 1.5% | |
| Other | 0.8% | |
| Jefferson | Gore | 37.9% | |
| Bush | 43.0% | |
| Nader | 2.7% | |
| Other | 16.3% | |
| Johnson | Gore | 59.1% | |
| Bush | 33.9% | |
| Nader | 6.2% | |
| Other | 0.8% | |
| Jones | Gore | 51.3% | |
| Bush | 45.9% | |
| Nader | 2.1% | |
| Other | 0.6% | |
| Keokuk | Gore | 44.1% | |
| Bush | 52.0% | |
| Nader | 2.0% | |
| Other | 1.9% | |
| Kossuth | Gore | 44.6% | |
| Bush | 51.9% | |
| Nader | 2.3% | |
| Other | 1.1% | |
| Lee | Gore | 58.1% | |
| Bush | 38.3% | |
| Nader | 2.0% | |
| Other | 1.7% | |
| Linn | Gore | 53.1% | |
| Bush | 43.9% | |
| Nader | 2.3% | |
| Other | 0.7% | |
| Louisa | Gore | 49.5% | |
| Bush | 47.6% | |
| Nader | 1.8% | |
| Other | 1.1% | |
| Lucas | Gore | 44.9% | |
| Bush | 52.6% | |
| Nader | 1.5% | |
| Other | 1.0% | |
| Lyon | Gore | 24.6% | |
| Bush | 73.3% | |
| Nader | 1.3% | |
| Other | 0.8% | |
| Madison | Gore | 44.4% | |
| Bush | 52.5% | |
| Nader | 1.8% | |
| Other | 1.2% | |
| Mahaska | Gore | 35.3% | |
| Bush | 62.6% | |
| Nader | 1.5% | |
| Other | 0.6% | |
| Marion | Gore | 39.8% | |
| Bush | 58.0% | |
| Nader | 1.4% | |
| Other | 0.7% | |
| Marshall | Gore | 47.2% | |
| Bush | 49.8% | |
| Nader | 1.9% | |
| Other | 1.0% | |
| Mills | Gore | 34.5% | |
| Bush | 62.3% | |
| Nader | 2.1% | |
| Other | 1.1% | |
| Mitchell | Gore | 51.3% | |
| Bush | 46.3% | |
| Nader | 1.7% | |
| Other | 0.7% | |
| Monona | Gore | 45.7% | |
| Bush | 50.5% | |
| Nader | 2.0% | |
| Other | 1.7% | |
| Monroe | Gore | 46.6% | |
| Bush | 50.9% | |
| Nader | 1.5% | |
| Other | 1.0% | |
| Montgomery | Gore | 34.1% | |
| Bush | 63.3% | |
| Nader | 1.6% | |
| Other | 1.0% | |
| Muscatine | Gore | 50.1% | |
| Bush | 46.5% | |
| Nader | 2.3% | |
| Other | 1.0% | |
| O'Brien | Gore | 30.8% | |
| Bush | 66.4% | |
| Nader | 1.5% | |
| Other | 1.3% | |
| Osceola | Gore | 29.8% | |
| Bush | 67.4% | |
| Nader | 1.8% | |
| Other | 1.0% | |
| Page | Gore | 32.5% | |
| Bush | 65.0% | |
| Nader | 1.8% | |
| Other | 0.8% | |
| Palo Alto | Gore | 48.2% | |
| Bush | 48.5% | |
| Nader | 1.7% | |
| Other | 1.6% | |
| Plymouth | Gore | 34.6% | |
| Bush | 61.2% | |
| Nader | 2.0% | |
| Other | 2.3% | |
| Pocahontas | Gore | 41.9% | |
| Bush | 54.1% | |
| Nader | 1.9% | |
| Other | 2.1% | |
| Polk | Gore | 51.5% | |
| Bush | 45.9% | |
| Nader | 1.9% | |
| Other | 0.7% | |
| Pottawattamie | Gore | 42.7% | |
| Bush | 54.5% | |
| Nader | 2.0% | |
| Other | 0.8% | |
| Poweshiek | Gore | 47.0% | |
| Bush | 49.0% | |
| Nader | 3.2% | |
| Other | 0.8% | |
| Ringgold | Gore | 46.3% | |
| Bush | 50.9% | |
| Nader | 1.7% | |
| Other | 1.1% | |
| Sac | Gore | 41.7% | |
| Bush | 55.2% | |
| Nader | 1.9% | |
| Other | 1.2% | |
| Scott | Gore | 50.8% | |
| Bush | 46.5% | |
| Nader | 2.0% | |
| Other | 0.7% | |
| Shelby | Gore | 36.3% | |
| Bush | 60.8% | |
| Nader | 1.9% | |
| Other | 1.0% | |
| Sioux | Gore | 14.6% | |
| Bush | 83.3% | |
| Nader | 1.1% | |
| Other | 1.0% | |
| Story | Gore | 49.4% | |
| Bush | 45.9% | |
| Nader | 3.7% | |
| Other | 1.0% | |
| Tama | Gore | 48.6% | |
| Bush | 48.5% | |
| Nader | 1.9% | |
| Other | 0.9% | |
| Taylor | Gore | 40.3% | |
| Bush | 57.2% | |
| Nader | 1.5% | |
| Other | 1.1% | |
| Union | Gore | 44.3% | |
| Bush | 52.3% | |
| Nader | 1.9% | |
| Other | 1.6% | |
| Van Buren | Gore | 40.4% | |
| Bush | 56.6% | |
| Nader | 1.4% | |
| Other | 1.5% | |
| Wapello | Gore | 55.2% | |
| Bush | 41.7% | |
| Nader | 2.1% | |
| Other | 1.0% | |
| Warren | Gore | 48.4% | |
| Bush | 49.0% | |
| Nader | 1.9% | |
| Other | 0.7% | |
| Washington | Gore | 43.2% | |
| Bush | 53.1% | |
| Nader | 2.7% | |
| Other | 1.0% | |
| Wayne | Gore | 43.0% | |
| Bush | 55.1% | |
| Nader | 1.0% | |
| Other | 0.8% | |
| Webster | Gore | 49.7% | |
| Bush | 47.9% | |
| Nader | 1.7% | |
| Other | 0.7% | |
| Winnebago | Gore | 48.7% | |
| Bush | 48.2% | |
| Nader | 2.1% | |
| Other | 1.1% | |
| Winneshiek | Gore | 46.1% | |
| Bush | 49.3% | |
| Nader | 3.6% | |
| Other | 0.9% | |
| Woodbury | Gore | 46.7% | |
| Bush | 49.8% | |
| Nader | 2.1% | |
| Other | 1.4% | |
| Worth | Gore | 55.1% | |
| Bush | 41.4% | |
| Nader | 2.3% | |
| Other | 1.1% | |
| Wright | Gore | 44.1% | |
| Bush | 53.4% | |
| Nader | 1.7% | |
| Other | 0.8% | |