2000 Presidential General Election Data Graphs - Maine
Note: The Google advertisement links below may advocate political positions that this site does not endorse.
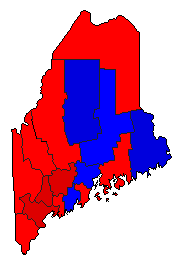
Map

AndroscogginGore53.3%
 
Bush40.5%
 
Nader4.8%
 
Other1.3%


AroostookGore48.9%
 
Bush47.1%
 
Nader3.0%
 
Other1.0%


CumberlandGore52.0%
 
Bush41.0%
 
Nader6.0%
 
Other0.9%


FranklinGore49.2%
 
Bush41.8%
 
Nader7.2%
 
Other1.8%


HancockGore45.4%
 
Bush44.6%
 
Nader8.8%
 
Other1.2%


KennebecGore53.0%
 
Bush40.7%
 
Nader5.0%
 
Other1.3%


KnoxGore46.1%
 
Bush43.7%
 
Nader8.8%
 
Other1.3%


LincolnGore43.9%
 
Bush48.1%
 
Nader6.7%
 
Other1.3%


OxfordGore49.6%
 
Bush43.0%
 
Nader5.5%
 
Other1.8%


PenobscotGore44.9%
 
Bush48.7%
 
Nader5.2%
 
Other1.3%


PiscataquisGore40.5%
 
Bush52.3%
 
Nader5.1%
 
Other2.1%


SagadahocGore48.0%
 
Bush43.7%
 
Nader6.9%
 
Other1.3%


SomersetGore48.2%
 
Bush44.6%
 
Nader5.2%
 
Other2.0%


WaldoGore44.3%
 
Bush45.4%
 
Nader8.8%
 
Other1.5%


WashingtonGore42.7%
 
Bush50.7%
 
Nader5.1%
 
Other1.6%


YorkGore49.3%
 
Bush44.7%
 
Nader4.9%
 
Other1.1%


National DataGraph for 2000 - Maine Results for 2000

Login

Terms of Use - DCMA Policy - Privacy Policy and Cookies


© Dave Leip's Atlas of U.S. Elections, LLC 2019 All Rights Reserved