2000 Presidential General Election Data Graphs - Missouri
by County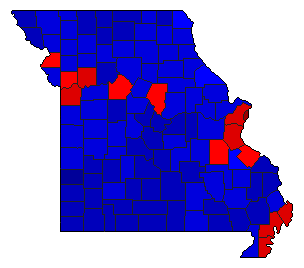
| Adair | Gore | 38.9% | |
| Bush | 57.3% | |
| Nader | 2.9% | |
| Other | 0.9% | |
| Andrew | Gore | 38.4% | |
| Bush | 58.5% | |
| Nader | 1.8% | |
| Other | 1.3% | |
| Atchison | Gore | 35.3% | |
| Bush | 62.6% | |
| Nader | 1.2% | |
| Other | 0.9% | |
| Audrain | Gore | 45.6% | |
| Bush | 52.6% | |
| Nader | 1.1% | |
| Other | 0.7% | |
| Barry | Gore | 33.4% | |
| Bush | 63.8% | |
| Nader | 1.6% | |
| Other | 1.3% | |
| Barton | Gore | 26.5% | |
| Bush | 71.5% | |
| Nader | 1.4% | |
| Other | 0.6% | |
| Bates | Gore | 43.5% | |
| Bush | 54.5% | |
| Nader | 1.1% | |
| Other | 1.0% | |
| Benton | Gore | 41.8% | |
| Bush | 56.0% | |
| Nader | 1.3% | |
| Other | 0.9% | |
| Bollinger | Gore | 32.0% | |
| Bush | 65.9% | |
| Nader | 0.8% | |
| Other | 1.4% | |
| Boone | Gore | 48.3% | |
| Bush | 47.7% | |
| Nader | 3.2% | |
| Other | 0.8% | |
| Buchanan | Gore | 49.2% | |
| Bush | 47.3% | |
| Nader | 2.2% | |
| Other | 1.3% | |
| Butler | Gore | 34.7% | |
| Bush | 63.3% | |
| Nader | 1.0% | |
| Other | 1.0% | |
| Caldwell | Gore | 38.6% | |
| Bush | 57.7% | |
| Nader | 2.0% | |
| Other | 1.7% | |
| Callaway | Gore | 43.8% | |
| Bush | 53.8% | |
| Nader | 1.4% | |
| Other | 0.9% | |
| Camden | Gore | 37.0% | |
| Bush | 60.6% | |
| Nader | 1.5% | |
| Other | 0.9% | |
| Cape Girardeau | Gore | 31.3% | |
| Bush | 66.4% | |
| Nader | 1.3% | |
| Other | 1.1% | |
| Carroll | Gore | 35.4% | |
| Bush | 62.9% | |
| Nader | 1.2% | |
| Other | 0.6% | |
| Carter | Gore | 35.5% | |
| Bush | 61.6% | |
| Nader | 1.4% | |
| Other | 1.5% | |
| Cass | Gore | 41.6% | |
| Bush | 56.1% | |
| Nader | 1.4% | |
| Other | 0.9% | |
| Cedar | Gore | 34.9% | |
| Bush | 62.3% | |
| Nader | 1.4% | |
| Other | 1.3% | |
| Chariton | Gore | 43.1% | |
| Bush | 55.4% | |
| Nader | 0.7% | |
| Other | 0.8% | |
| Christian | Gore | 34.0% | |
| Bush | 63.8% | |
| Nader | 1.2% | |
| Other | 1.0% | |
| Clark | Gore | 47.7% | |
| Bush | 49.9% | |
| Nader | 1.4% | |
| Other | 1.0% | |
| Clay | Gore | 48.7% | |
| Bush | 48.7% | |
| Nader | 1.8% | |
| Other | 0.7% | |
| Clinton | Gore | 46.8% | |
| Bush | 50.7% | |
| Nader | 1.5% | |
| Other | 1.1% | |
| Cole | Gore | 36.8% | |
| Bush | 61.5% | |
| Nader | 1.1% | |
| Other | 0.6% | |
| Cooper | Gore | 37.8% | |
| Bush | 60.0% | |
| Nader | 1.1% | |
| Other | 1.1% | |
| Crawford | Gore | 40.4% | |
| Bush | 57.3% | |
| Nader | 1.2% | |
| Other | 1.2% | |
| Dade | Gore | 31.8% | |
| Bush | 65.8% | |
| Nader | 1.1% | |
| Other | 1.3% | |
| Dallas | Gore | 37.2% | |
| Bush | 59.9% | |
| Nader | 1.2% | |
| Other | 1.8% | |
| Daviess | Gore | 39.1% | |
| Bush | 57.6% | |
| Nader | 1.7% | |
| Other | 1.7% | |
| DeKalb | Gore | 38.6% | |
| Bush | 58.4% | |
| Nader | 1.6% | |
| Other | 1.5% | |
| Dent | Gore | 30.7% | |
| Bush | 66.7% | |
| Nader | 1.1% | |
| Other | 1.5% | |
| Douglas | Gore | 29.3% | |
| Bush | 68.1% | |
| Nader | 1.0% | |
| Other | 1.6% | |
| Dunklin | Gore | 47.0% | |
| Bush | 51.6% | |
| Nader | 0.7% | |
| Other | 0.7% | |
| Franklin | Gore | 41.3% | |
| Bush | 55.8% | |
| Nader | 1.7% | |
| Other | 1.2% | |
| Gasconade | Gore | 34.0% | |
| Bush | 63.2% | |
| Nader | 1.7% | |
| Other | 1.1% | |
| Gentry | Gore | 40.9% | |
| Bush | 57.0% | |
| Nader | 1.3% | |
| Other | 0.8% | |
| Greene | Gore | 39.9% | |
| Bush | 57.5% | |
| Nader | 1.7% | |
| Other | 0.9% | |
| Grundy | Gore | 33.2% | |
| Bush | 63.2% | |
| Nader | 2.2% | |
| Other | 1.4% | |
| Harrison | Gore | 33.3% | |
| Bush | 63.9% | |
| Nader | 1.6% | |
| Other | 1.2% | |
| Henry | Gore | 45.6% | |
| Bush | 52.4% | |
| Nader | 1.3% | |
| Other | 0.8% | |
| Hickory | Gore | 46.3% | |
| Bush | 51.3% | |
| Nader | 1.3% | |
| Other | 1.2% | |
| Holt | Gore | 32.7% | |
| Bush | 65.3% | |
| Nader | 0.9% | |
| Other | 1.1% | |
| Howard | Gore | 43.1% | |
| Bush | 53.5% | |
| Nader | 1.8% | |
| Other | 1.6% | |
| Howell | Gore | 33.0% | |
| Bush | 64.1% | |
| Nader | 1.4% | |
| Other | 1.6% | |
| Iron | Gore | 46.3% | |
| Bush | 50.7% | |
| Nader | 1.4% | |
| Other | 1.6% | |
| Jackson | Gore | 59.0% | |
| Bush | 38.4% | |
| Nader | 1.9% | |
| Other | 0.8% | |
| Jasper | Gore | 31.3% | |
| Bush | 66.4% | |
| Nader | 1.5% | |
| Other | 0.7% | |
| Jefferson | Gore | 50.0% | |
| Bush | 47.6% | |
| Nader | 1.5% | |
| Other | 0.8% | |
| Johnson | Gore | 41.3% | |
| Bush | 55.6% | |
| Nader | 1.9% | |
| Other | 1.2% | |
| Knox | Gore | 38.3% | |
| Bush | 59.7% | |
| Nader | 1.2% | |
| Other | 0.9% | |
| Laclede | Gore | 32.1% | |
| Bush | 65.6% | |
| Nader | 1.1% | |
| Other | 1.3% | |
| Lafayette | Gore | 43.7% | |
| Bush | 54.1% | |
| Nader | 1.4% | |
| Other | 0.8% | |
| Lawrence | Gore | 32.8% | |
| Bush | 64.4% | |
| Nader | 1.4% | |
| Other | 1.4% | |
| Lewis | Gore | 45.1% | |
| Bush | 53.3% | |
| Nader | 0.8% | |
| Other | 0.9% | |
| Lincoln | Gore | 43.7% | |
| Bush | 53.7% | |
| Nader | 1.4% | |
| Other | 1.1% | |
| Linn | Gore | 44.0% | |
| Bush | 54.0% | |
| Nader | 1.1% | |
| Other | 0.9% | |
| Livingston | Gore | 38.6% | |
| Bush | 59.1% | |
| Nader | 1.6% | |
| Other | 0.7% | |
| McDonald | Gore | 28.6% | |
| Bush | 68.3% | |
| Nader | 1.6% | |
| Other | 1.5% | |
| Macon | Gore | 39.3% | |
| Bush | 59.0% | |
| Nader | 1.0% | |
| Other | 0.7% | |
| Madison | Gore | 41.8% | |
| Bush | 56.3% | |
| Nader | 1.0% | |
| Other | 1.0% | |
| Maries | Gore | 40.3% | |
| Bush | 57.5% | |
| Nader | 0.8% | |
| Other | 1.3% | |
| Marion | Gore | 42.6% | |
| Bush | 55.9% | |
| Nader | 0.7% | |
| Other | 0.7% | |
| Mercer | Gore | 30.1% | |
| Bush | 67.9% | |
| Nader | 1.1% | |
| Other | 0.9% | |
| Miller | Gore | 34.4% | |
| Bush | 63.5% | |
| Nader | 1.4% | |
| Other | 0.7% | |
| Mississippi | Gore | 52.8% | |
| Bush | 45.9% | |
| Nader | 0.6% | |
| Other | 0.7% | |
| Moniteau | Gore | 35.9% | |
| Bush | 62.1% | |
| Nader | 1.0% | |
| Other | 1.1% | |
| Monroe | Gore | 45.4% | |
| Bush | 53.1% | |
| Nader | 0.5% | |
| Other | 1.0% | |
| Montgomery | Gore | 39.4% | |
| Bush | 58.6% | |
| Nader | 1.3% | |
| Other | 0.7% | |
| Morgan | Gore | 41.0% | |
| Bush | 56.6% | |
| Nader | 1.1% | |
| Other | 1.3% | |
| New Madrid | Gore | 51.4% | |
| Bush | 47.0% | |
| Nader | 0.6% | |
| Other | 0.9% | |
| Newton | Gore | 30.5% | |
| Bush | 67.3% | |
| Nader | 1.5% | |
| Other | 0.7% | |
| Nodaway | Gore | 39.3% | |
| Bush | 57.0% | |
| Nader | 2.4% | |
| Other | 1.3% | |
| Oregon | Gore | 37.0% | |
| Bush | 59.6% | |
| Nader | 1.4% | |
| Other | 2.0% | |
| Osage | Gore | 31.4% | |
| Bush | 67.2% | |
| Nader | 0.8% | |
| Other | 0.6% | |
| Ozark | Gore | 33.4% | |
| Bush | 62.0% | |
| Nader | 2.7% | |
| Other | 1.8% | |
| Pemiscot | Gore | 53.5% | |
| Bush | 45.4% | |
| Nader | 0.6% | |
| Other | 0.5% | |
| Perry | Gore | 30.2% | |
| Bush | 67.6% | |
| Nader | 1.0% | |
| Other | 1.2% | |
| Pettis | Gore | 37.2% | |
| Bush | 60.5% | |
| Nader | 1.4% | |
| Other | 0.9% | |
| Phelps | Gore | 38.8% | |
| Bush | 58.5% | |
| Nader | 1.6% | |
| Other | 1.2% | |
| Pike | Gore | 48.4% | |
| Bush | 49.6% | |
| Nader | 1.1% | |
| Other | 0.9% | |
| Platte | Gore | 45.0% | |
| Bush | 52.2% | |
| Nader | 1.9% | |
| Other | 0.9% | |
| Polk | Gore | 35.0% | |
| Bush | 62.5% | |
| Nader | 1.2% | |
| Other | 1.4% | |
| Pulaski | Gore | 36.1% | |
| Bush | 62.0% | |
| Nader | 1.1% | |
| Other | 0.8% | |
| Putnam | Gore | 30.3% | |
| Bush | 68.3% | |
| Nader | 0.8% | |
| Other | 0.6% | |
| Ralls | Gore | 44.8% | |
| Bush | 53.9% | |
| Nader | 0.8% | |
| Other | 0.6% | |
| Randolph | Gore | 44.8% | |
| Bush | 52.7% | |
| Nader | 1.2% | |
| Other | 1.2% | |
| Ray | Gore | 51.0% | |
| Bush | 46.3% | |
| Nader | 1.5% | |
| Other | 1.2% | |
| Reynolds | Gore | 41.5% | |
| Bush | 56.3% | |
| Nader | 1.3% | |
| Other | 0.9% | |
| Ripley | Gore | 35.9% | |
| Bush | 61.6% | |
| Nader | 1.1% | |
| Other | 1.3% | |
| St. Charles | Gore | 41.8% | |
| Bush | 56.0% | |
| Nader | 1.5% | |
| Other | 0.7% | |
| St. Clair | Gore | 39.4% | |
| Bush | 57.6% | |
| Nader | 1.7% | |
| Other | 1.3% | |
| Ste. Genevieve | Gore | 49.2% | |
| Bush | 47.9% | |
| Nader | 1.7% | |
| Other | 1.1% | |
| St. Francois | Gore | 48.2% | |
| Bush | 49.5% | |
| Nader | 1.4% | |
| Other | 0.9% | |
| St. Louis | Gore | 51.5% | |
| Bush | 46.1% | |
| Nader | 1.7% | |
| Other | 0.6% | |
| Saline | Gore | 49.0% | |
| Bush | 48.9% | |
| Nader | 1.4% | |
| Other | 0.7% | |
| Schuyler | Gore | 40.3% | |
| Bush | 57.8% | |
| Nader | 0.8% | |
| Other | 1.1% | |
| Scotland | Gore | 36.3% | |
| Bush | 61.3% | |
| Nader | 1.7% | |
| Other | 0.8% | |
| Scott | Gore | 41.1% | |
| Bush | 57.3% | |
| Nader | 0.7% | |
| Other | 0.9% | |
| Shannon | Gore | 37.8% | |
| Bush | 59.4% | |
| Nader | 1.3% | |
| Other | 1.5% | |
| Shelby | Gore | 38.7% | |
| Bush | 59.4% | |
| Nader | 1.1% | |
| Other | 0.7% | |
| Stoddard | Gore | 35.9% | |
| Bush | 62.0% | |
| Nader | 0.9% | |
| Other | 1.1% | |
| Stone | Gore | 33.4% | |
| Bush | 64.1% | |
| Nader | 1.5% | |
| Other | 1.0% | |
| Sullivan | Gore | 36.8% | |
| Bush | 61.3% | |
| Nader | 0.9% | |
| Other | 1.1% | |
| Taney | Gore | 33.7% | |
| Bush | 63.8% | |
| Nader | 1.3% | |
| Other | 1.1% | |
| Texas | Gore | 35.1% | |
| Bush | 61.8% | |
| Nader | 1.4% | |
| Other | 1.7% | |
| Vernon | Gore | 37.5% | |
| Bush | 59.3% | |
| Nader | 1.9% | |
| Other | 1.3% | |
| Warren | Gore | 42.1% | |
| Bush | 55.7% | |
| Nader | 1.4% | |
| Other | 0.8% | |
| Washington | Gore | 49.0% | |
| Bush | 48.6% | |
| Nader | 1.1% | |
| Other | 1.2% | |
| Wayne | Gore | 40.8% | |
| Bush | 57.2% | |
| Nader | 0.9% | |
| Other | 1.0% | |
| Webster | Gore | 35.1% | |
| Bush | 61.9% | |
| Nader | 1.4% | |
| Other | 1.6% | |
| Worth | Gore | 40.5% | |
| Bush | 56.2% | |
| Nader | 1.3% | |
| Other | 2.0% | |
| Wright | Gore | 28.7% | |
| Bush | 68.8% | |
| Nader | 1.1% | |
| Other | 1.5% | |
City| St. Louis | Gore | 77.4% | |
| Bush | 19.9% | |
| Nader | 2.1% | |
| Other | 0.6% | |