2000 Presidential Republican Primary Election Data Graphs - New York
Note: The Google advertisement links below may advocate political positions that this site does not endorse.
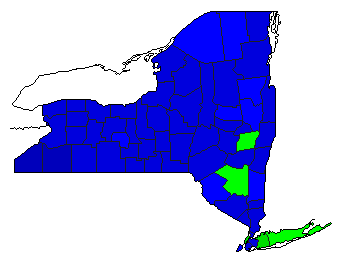
Map

AlbanyKeyes3.8%
 
Bush44.8%
 
McCain49.3%
 
Other2.2%


AlleganyKeyes4.5%
 
Bush57.7%
 
McCain35.9%
 
Other1.9%


BroomeKeyes3.3%
 
Bush53.3%
 
McCain40.6%
 
Other2.7%


CattaraugusKeyes3.2%
 
Bush60.4%
 
McCain33.4%
 
Other3.1%


CayugaKeyes3.8%
 
Bush51.0%
 
McCain42.1%
 
Other3.1%


ChautauquaKeyes3.8%
 
Bush60.0%
 
McCain32.9%
 
Other3.2%


ChemungKeyes3.4%
 
Bush54.0%
 
McCain39.9%
 
Other2.7%


ChenangoKeyes3.2%
 
Bush51.7%
 
McCain42.2%
 
Other2.9%


ClintonKeyes2.9%
 
Bush55.4%
 
McCain39.4%
 
Other2.4%


ColumbiaKeyes2.5%
 
Bush54.8%
 
McCain40.3%
 
Other2.4%


CortlandKeyes3.7%
 
Bush50.3%
 
McCain42.2%
 
Other3.8%


DelawareKeyes3.5%
 
Bush53.6%
 
McCain39.3%
 
Other3.6%


DutchessKeyes4.5%
 
Bush49.7%
 
McCain43.5%
 
Other2.3%


ErieKeyes3.6%
 
Bush50.3%
 
McCain43.4%
 
Other2.6%


EssexKeyes3.6%
 
Bush53.7%
 
McCain40.9%
 
Other1.8%


FranklinKeyes3.2%
 
Bush46.8%
 
McCain46.0%
 
Other4.0%


FultonKeyes3.5%
 
Bush47.3%
 
McCain46.8%
 
Other2.3%


GeneseeKeyes4.7%
 
Bush57.3%
 
McCain35.2%
 
Other2.7%


GreeneKeyes2.7%
 
Bush55.2%
 
McCain39.5%
 
Other2.6%


HamiltonKeyes2.7%
 
Bush53.2%
 
McCain41.1%
 
Other2.9%


HerkimerKeyes3.6%
 
Bush52.9%
 
McCain40.6%
 
Other2.9%


JeffersonKeyes2.2%
 
Bush56.2%
 
McCain39.1%
 
Other2.5%


LewisKeyes2.7%
 
Bush53.9%
 
McCain39.7%
 
Other3.6%


LivingstonKeyes4.7%
 
Bush58.1%
 
McCain34.2%
 
Other3.0%


MadisonKeyes5.5%
 
Bush51.3%
 
McCain40.8%
 
Other2.4%


MonroeKeyes4.3%
 
Bush56.4%
 
McCain37.1%
 
Other2.2%


MontgomeryKeyes4.0%
 
Bush57.8%
 
McCain35.3%
 
Other3.0%


NassauKeyes3.7%
 
Bush42.1%
 
McCain51.4%
 
Other2.9%


NiagaraKeyes4.1%
 
Bush52.8%
 
McCain40.7%
 
Other2.3%


OneidaKeyes4.2%
 
Bush54.3%
 
McCain39.3%
 
Other2.2%


OnondagaKeyes4.4%
 
Bush50.1%
 
McCain42.7%
 
Other2.9%


OntarioKeyes4.8%
 
Bush52.9%
 
McCain39.3%
 
Other3.0%


OrangeKeyes4.5%
 
Bush50.1%
 
McCain43.0%
 
Other2.4%


OrleansKeyes5.2%
 
Bush59.4%
 
McCain32.6%
 
Other2.8%


OswegoKeyes3.5%
 
Bush53.4%
 
McCain40.5%
 
Other2.6%


OtsegoKeyes4.2%
 
Bush52.2%
 
McCain40.3%
 
Other3.2%


PutnamKeyes3.4%
 
Bush50.8%
 
McCain43.8%
 
Other2.1%


RensselaerKeyes2.9%
 
Bush51.0%
 
McCain44.2%
 
Other1.9%


RocklandKeyes4.4%
 
Bush52.6%
 
McCain40.6%
 
Other2.4%


St. LawrenceKeyes2.6%
 
Bush48.5%
 
McCain45.7%
 
Other3.2%


SaratogaKeyes2.7%
 
Bush49.7%
 
McCain45.7%
 
Other1.9%


SchenectadyKeyes3.2%
 
Bush52.2%
 
McCain42.5%
 
Other2.1%


SchoharieKeyes3.6%
 
Bush55.8%
 
McCain38.6%
 
Other2.0%


SchuylerKeyes3.5%
 
Bush55.8%
 
McCain36.8%
 
Other3.9%


SenecaKeyes4.6%
 
Bush54.5%
 
McCain38.1%
 
Other2.7%


SteubenKeyes3.9%
 
Bush57.1%
 
McCain35.7%
 
Other3.3%


SuffolkKeyes3.0%
 
Bush46.8%
 
McCain47.7%
 
Other2.4%


SullivanKeyes4.8%
 
Bush47.6%
 
McCain44.6%
 
Other3.0%


TiogaKeyes4.2%
 
Bush54.1%
 
McCain39.2%
 
Other2.5%


TompkinsKeyes4.9%
 
Bush50.3%
 
McCain42.7%
 
Other2.1%


UlsterKeyes4.9%
 
Bush44.1%
 
McCain49.0%
 
Other2.1%


WarrenKeyes2.8%
 
Bush48.5%
 
McCain47.0%
 
Other1.7%


WashingtonKeyes3.4%
 
Bush50.6%
 
McCain44.4%
 
Other1.6%


WayneKeyes4.9%
 
Bush56.4%
 
McCain35.2%
 
Other3.5%


WestchesterKeyes2.9%
 
Bush50.1%
 
McCain45.1%
 
Other1.9%


WyomingKeyes4.8%
 
Bush56.8%
 
McCain35.4%
 
Other3.0%


YatesKeyes3.1%
 
Bush48.2%
 
McCain44.0%
 
Other4.7%


BronxKeyes1.5%
 
Bush53.2%
 
McCain40.7%
 
Other4.6%


KingsKeyes2.7%
 
Bush50.1%
 
McCain43.2%
 
Other4.1%


New YorkKeyes2.6%
 
Bush43.5%
 
McCain51.7%
 
Other2.3%


QueensKeyes3.9%
 
Bush50.4%
 
McCain41.9%
 
Other3.7%


RichmondKeyes2.5%
 
Bush49.7%
 
McCain46.1%
 
Other1.8%


National DataGraph for 2000 - New York Results for 2000

Login

Terms of Use - DCMA Policy - Privacy Policy and Cookies


© Dave Leip's Atlas of U.S. Elections, LLC 2019 All Rights Reserved