2000 Presidential General Election Data Graphs - North Dakota
Note: The Google advertisement links below may advocate political positions that this site does not endorse.
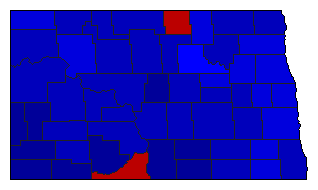
Map

AdamsGore24.7%
 
Bush71.2%
 
Nader2.0%
 
Other2.2%


BarnesGore33.6%
 
Bush60.1%
 
Nader2.8%
 
Other3.5%


BensonGore44.2%
 
Bush49.0%
 
Nader2.3%
 
Other4.5%


BillingsGore15.6%
 
Bush75.0%
 
Nader2.9%
 
Other6.5%


BottineauGore31.8%
 
Bush63.7%
 
Nader2.6%
 
Other2.0%


BowmanGore22.4%
 
Bush73.4%
 
Nader2.7%
 
Other1.4%


BurkeGore28.5%
 
Bush67.2%
 
Nader1.9%
 
Other2.4%


BurleighGore28.5%
 
Bush65.2%
 
Nader3.3%
 
Other3.0%


CassGore36.4%
 
Bush56.8%
 
Nader4.3%
 
Other2.5%


CavalierGore26.1%
 
Bush63.8%
 
Nader3.1%
 
Other7.0%


DickeyGore28.9%
 
Bush66.5%
 
Nader1.9%
 
Other2.7%


DivideGore38.5%
 
Bush55.8%
 
Nader3.0%
 
Other2.6%


DunnGore27.4%
 
Bush65.0%
 
Nader3.1%
 
Other4.4%


EddyGore36.1%
 
Bush55.4%
 
Nader2.8%
 
Other5.6%


EmmonsGore20.3%
 
Bush71.8%
 
Nader2.1%
 
Other5.8%


FosterGore27.2%
 
Bush67.2%
 
Nader2.6%
 
Other2.9%


Golden ValleyGore19.2%
 
Bush75.2%
 
Nader3.2%
 
Other2.3%


Grand ForksGore37.3%
 
Bush55.9%
 
Nader4.8%
 
Other1.9%


GrantGore16.5%
 
Bush75.5%
 
Nader1.9%
 
Other6.2%


GriggsGore32.9%
 
Bush62.6%
 
Nader1.3%
 
Other3.1%


HettingerGore23.2%
 
Bush69.6%
 
Nader2.9%
 
Other4.3%


KidderGore22.2%
 
Bush65.6%
 
Nader2.3%
 
Other10.0%


LaMoureGore27.9%
 
Bush64.4%
 
Nader2.0%
 
Other5.6%


LoganGore19.5%
 
Bush70.9%
 
Nader1.2%
 
Other8.4%


McHenryGore32.4%
 
Bush61.5%
 
Nader2.9%
 
Other3.2%


McIntoshGore21.4%
 
Bush72.0%
 
Nader2.2%
 
Other4.5%


McKenzieGore27.6%
 
Bush69.1%
 
Nader1.9%
 
Other1.4%


McLeanGore31.5%
 
Bush62.2%
 
Nader2.5%
 
Other3.7%


MercerGore23.2%
 
Bush68.6%
 
Nader3.6%
 
Other4.6%


MortonGore30.6%
 
Bush62.3%
 
Nader3.0%
 
Other4.0%


MountrailGore43.4%
 
Bush50.6%
 
Nader3.6%
 
Other2.4%


NelsonGore37.3%
 
Bush56.0%
 
Nader2.7%
 
Other4.0%


OliverGore23.2%
 
Bush67.5%
 
Nader3.4%
 
Other5.9%


PembinaGore28.9%
 
Bush64.3%
 
Nader2.9%
 
Other3.9%


PierceGore25.4%
 
Bush68.4%
 
Nader2.7%
 
Other3.5%


RamseyGore33.3%
 
Bush60.4%
 
Nader3.2%
 
Other3.1%


RansomGore39.7%
 
Bush54.7%
 
Nader2.5%
 
Other3.1%


RenvilleGore33.3%
 
Bush61.6%
 
Nader2.8%
 
Other2.4%


RichlandGore31.1%
 
Bush62.4%
 
Nader3.0%
 
Other3.6%


RoletteGore61.0%
 
Bush32.2%
 
Nader3.1%
 
Other3.7%


SargentGore43.9%
 
Bush50.5%
 
Nader2.2%
 
Other3.4%


SheridanGore17.3%
 
Bush76.2%
 
Nader1.4%
 
Other5.1%


SiouxGore69.5%
 
Bush25.8%
 
Nader1.5%
 
Other3.1%


SlopeGore19.2%
 
Bush71.5%
 
Nader3.8%
 
Other5.4%


StarkGore28.5%
 
Bush65.3%
 
Nader3.1%
 
Other3.1%


SteeleGore39.3%
 
Bush54.1%
 
Nader2.3%
 
Other4.3%


StutsmanGore33.6%
 
Bush60.2%
 
Nader2.8%
 
Other3.4%


TownerGore34.5%
 
Bush58.4%
 
Nader2.6%
 
Other4.5%


TraillGore36.8%
 
Bush58.2%
 
Nader2.3%
 
Other2.7%


WalshGore33.6%
 
Bush59.8%
 
Nader2.1%
 
Other4.5%


WardGore33.5%
 
Bush62.3%
 
Nader2.7%
 
Other1.6%


WellsGore27.4%
 
Bush66.8%
 
Nader2.1%
 
Other3.7%


WilliamsGore29.8%
 
Bush66.4%
 
Nader2.0%
 
Other1.7%


National DataGraph for 2000 - North Dakota Results for 2000

Login

Terms of Use - DCMA Policy - Privacy Policy and Cookies


© Dave Leip's Atlas of U.S. Elections, LLC 2019 All Rights Reserved