2000 Presidential General Election Data Graphs - Arizona
by County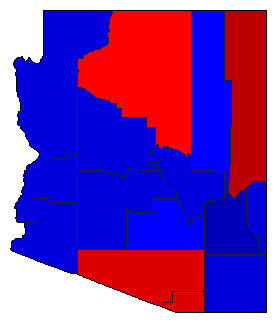
| Apache | Gore | 66.9% | |
| Bush | 30.6% | |
| Nader | 1.3% | |
| Other | 1.2% | |
| Cochise | Gore | 40.2% | |
| Bush | 54.7% | |
| Nader | 3.3% | |
| Other | 1.8% | |
| Coconino | Gore | 49.6% | |
| Bush | 43.0% | |
| Nader | 6.1% | |
| Other | 1.4% | |
| Gila | Gore | 43.4% | |
| Bush | 51.6% | |
| Nader | 2.8% | |
| Other | 2.1% | |
| Graham | Gore | 34.7% | |
| Bush | 62.2% | |
| Nader | 1.5% | |
| Other | 1.6% | |
| Greenlee | Gore | 41.1% | |
| Bush | 54.7% | |
| Nader | 2.3% | |
| Other | 1.9% | |
| La Paz | Gore | 39.5% | |
| Bush | 56.7% | |
| Nader | 2.0% | |
| Other | 1.8% | |
| Maricopa | Gore | 42.9% | |
| Bush | 53.2% | |
| Nader | 2.5% | |
| Other | 1.4% | |
| Mohave | Gore | 39.6% | |
| Bush | 55.2% | |
| Nader | 3.0% | |
| Other | 2.2% | |
| Navajo | Gore | 46.9% | |
| Bush | 49.3% | |
| Nader | 2.1% | |
| Other | 1.8% | |
| Pima | Gore | 51.3% | |
| Bush | 43.3% | |
| Nader | 4.3% | |
| Other | 1.0% | |
| Pinal | Gore | 47.6% | |
| Bush | 48.7% | |
| Nader | 2.2% | |
| Other | 1.5% | |
| Santa Cruz | Gore | 58.8% | |
| Bush | 37.6% | |
| Nader | 2.4% | |
| Other | 1.1% | |
| Yavapai | Gore | 35.3% | |
| Bush | 58.8% | |
| Nader | 4.0% | |
| Other | 1.9% | |
| Yuma | Gore | 42.1% | |
| Bush | 54.8% | |
| Nader | 1.7% | |
| Other | 1.4% | |