2000 Presidential General Election Data Graphs - Vermont
by County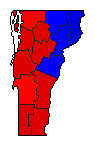
| Addison | Gore | 51.3% | |
| Bush | 39.9% | |
| Nader | 6.9% | |
| Other | 1.9% | |
| Bennington | Gore | 51.0% | |
| Bush | 41.2% | |
| Nader | 6.3% | |
| Other | 1.5% | |
| Caledonia | Gore | 43.0% | |
| Bush | 49.5% | |
| Nader | 5.7% | |
| Other | 1.9% | |
| Chittenden | Gore | 54.4% | |
| Bush | 36.2% | |
| Nader | 8.0% | |
| Other | 1.4% | |
| Essex | Gore | 39.0% | |
| Bush | 54.1% | |
| Nader | 4.6% | |
| Other | 2.3% | |
| Franklin | Gore | 49.6% | |
| Bush | 43.7% | |
| Nader | 4.3% | |
| Other | 2.4% | |
| Grand Isle | Gore | 50.4% | |
| Bush | 42.6% | |
| Nader | 4.8% | |
| Other | 2.2% | |
| Lamoille | Gore | 50.5% | |
| Bush | 39.6% | |
| Nader | 7.8% | |
| Other | 2.1% | |
| Orange | Gore | 45.6% | |
| Bush | 46.7% | |
| Nader | 6.0% | |
| Other | 1.7% | |
| Orleans | Gore | 45.1% | |
| Bush | 47.8% | |
| Nader | 4.6% | |
| Other | 2.4% | |
| Rutland | Gore | 47.6% | |
| Bush | 46.1% | |
| Nader | 4.6% | |
| Other | 1.6% | |
| Washington | Gore | 51.4% | |
| Bush | 38.5% | |
| Nader | 8.2% | |
| Other | 2.0% | |
| Windham | Gore | 52.7% | |
| Bush | 34.2% | |
| Nader | 11.5% | |
| Other | 1.6% | |
| Windsor | Gore | 51.9% | |
| Bush | 40.2% | |
| Nader | 6.1% | |
| Other | 1.7% | |