2000 Presidential General Election Data Graphs - West Virginia
by County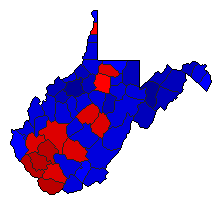
| Barbour | Gore | 41.4% | |
| Bush | 56.4% | |
| Nader | 1.5% | |
| Other | 0.8% | |
| Berkeley | Gore | 38.2% | |
| Bush | 59.2% | |
| Nader | 1.8% | |
| Other | 0.8% | |
| Boone | Gore | 61.9% | |
| Bush | 36.7% | |
| Nader | 0.9% | |
| Other | 0.5% | |
| Braxton | Gore | 51.0% | |
| Bush | 47.5% | |
| Nader | 0.9% | |
| Other | 0.6% | |
| Brooke | Gore | 49.7% | |
| Bush | 44.6% | |
| Nader | 2.4% | |
| Other | 3.2% | |
| Cabell | Gore | 46.2% | |
| Bush | 51.0% | |
| Nader | 1.9% | |
| Other | 0.9% | |
| Calhoun | Gore | 42.5% | |
| Bush | 54.5% | |
| Nader | 2.4% | |
| Other | 0.6% | |
| Clay | Gore | 45.1% | |
| Bush | 52.7% | |
| Nader | 1.4% | |
| Other | 0.8% | |
| Doddridge | Gore | 27.5% | |
| Bush | 69.4% | |
| Nader | 2.4% | |
| Other | 0.7% | |
| Fayette | Gore | 57.3% | |
| Bush | 40.3% | |
| Nader | 1.6% | |
| Other | 0.8% | |
| Gilmer | Gore | 39.9% | |
| Bush | 56.9% | |
| Nader | 2.4% | |
| Other | 0.8% | |
| Grant | Gore | 19.7% | |
| Bush | 78.8% | |
| Nader | 0.9% | |
| Other | 0.7% | |
| Greenbrier | Gore | 43.9% | |
| Bush | 53.6% | |
| Nader | 1.8% | |
| Other | 0.6% | |
| Hampshire | Gore | 33.9% | |
| Bush | 63.6% | |
| Nader | 1.6% | |
| Other | 0.9% | |
| Hancock | Gore | 46.4% | |
| Bush | 47.9% | |
| Nader | 2.4% | |
| Other | 3.2% | |
| Hardy | Gore | 35.9% | |
| Bush | 62.4% | |
| Nader | 1.0% | |
| Other | 0.7% | |
| Harrison | Gore | 48.9% | |
| Bush | 48.7% | |
| Nader | 1.6% | |
| Other | 0.7% | |
| Jackson | Gore | 42.9% | |
| Bush | 55.1% | |
| Nader | 1.4% | |
| Other | 0.6% | |
| Jefferson | Gore | 47.7% | |
| Bush | 49.0% | |
| Nader | 2.5% | |
| Other | 0.8% | |
| Kanawha | Gore | 50.2% | |
| Bush | 48.0% | |
| Nader | 1.2% | |
| Other | 0.5% | |
| Lewis | Gore | 38.4% | |
| Bush | 58.8% | |
| Nader | 1.9% | |
| Other | 1.0% | |
| Lincoln | Gore | 52.8% | |
| Bush | 45.4% | |
| Nader | 1.1% | |
| Other | 0.7% | |
| Logan | Gore | 61.8% | |
| Bush | 36.9% | |
| Nader | 0.6% | |
| Other | 0.6% | |
| McDowell | Gore | 66.3% | |
| Bush | 32.2% | |
| Nader | 0.9% | |
| Other | 0.6% | |
| Marion | Gore | 53.8% | |
| Bush | 43.6% | |
| Nader | 1.8% | |
| Other | 0.7% | |
| Marshall | Gore | 44.5% | |
| Bush | 50.8% | |
| Nader | 2.3% | |
| Other | 2.4% | |
| Mason | Gore | 44.2% | |
| Bush | 53.2% | |
| Nader | 1.7% | |
| Other | 0.8% | |
| Mercer | Gore | 44.2% | |
| Bush | 54.1% | |
| Nader | 1.2% | |
| Other | 0.5% | |
| Mineral | Gore | 34.2% | |
| Bush | 63.2% | |
| Nader | 1.9% | |
| Other | 0.8% | |
| Mingo | Gore | 60.2% | |
| Bush | 38.5% | |
| Nader | 0.7% | |
| Other | 0.5% | |
| Monongalia | Gore | 46.1% | |
| Bush | 49.7% | |
| Nader | 3.4% | |
| Other | 0.8% | |
| Monroe | Gore | 40.7% | |
| Bush | 57.2% | |
| Nader | 1.5% | |
| Other | 0.5% | |
| Morgan | Gore | 33.6% | |
| Bush | 63.0% | |
| Nader | 2.6% | |
| Other | 0.8% | |
| Nicholas | Gore | 47.3% | |
| Bush | 50.8% | |
| Nader | 1.3% | |
| Other | 0.6% | |
| Ohio | Gore | 42.6% | |
| Bush | 53.5% | |
| Nader | 2.2% | |
| Other | 1.7% | |
| Pendleton | Gore | 36.4% | |
| Bush | 62.0% | |
| Nader | 1.1% | |
| Other | 0.5% | |
| Pleasants | Gore | 39.5% | |
| Bush | 58.7% | |
| Nader | 0.8% | |
| Other | 1.0% | |
| Pocahontas | Gore | 40.1% | |
| Bush | 56.8% | |
| Nader | 2.0% | |
| Other | 1.0% | |
| Preston | Gore | 33.7% | |
| Bush | 63.3% | |
| Nader | 2.0% | |
| Other | 1.0% | |
| Putnam | Gore | 38.6% | |
| Bush | 59.6% | |
| Nader | 1.2% | |
| Other | 0.5% | |
| Raleigh | Gore | 45.9% | |
| Bush | 52.3% | |
| Nader | 1.2% | |
| Other | 0.5% | |
| Randolph | Gore | 42.2% | |
| Bush | 55.0% | |
| Nader | 2.1% | |
| Other | 0.7% | |
| Ritchie | Gore | 26.9% | |
| Bush | 71.3% | |
| Nader | 1.2% | |
| Other | 0.6% | |
| Roane | Gore | 41.5% | |
| Bush | 56.4% | |
| Nader | 1.7% | |
| Other | 0.5% | |
| Summers | Gore | 48.8% | |
| Bush | 48.9% | |
| Nader | 1.7% | |
| Other | 0.6% | |
| Taylor | Gore | 43.3% | |
| Bush | 54.7% | |
| Nader | 1.4% | |
| Other | 0.6% | |
| Tucker | Gore | 39.4% | |
| Bush | 57.8% | |
| Nader | 1.5% | |
| Other | 1.3% | |
| Tyler | Gore | 30.9% | |
| Bush | 65.7% | |
| Nader | 2.0% | |
| Other | 1.3% | |
| Upshur | Gore | 34.1% | |
| Bush | 63.6% | |
| Nader | 1.6% | |
| Other | 0.7% | |
| Wayne | Gore | 48.9% | |
| Bush | 49.2% | |
| Nader | 1.1% | |
| Other | 0.8% | |
| Webster | Gore | 53.3% | |
| Bush | 44.9% | |
| Nader | 1.1% | |
| Other | 0.8% | |
| Wetzel | Gore | 45.3% | |
| Bush | 51.5% | |
| Nader | 1.7% | |
| Other | 1.5% | |
| Wirt | Gore | 34.3% | |
| Bush | 63.7% | |
| Nader | 0.9% | |
| Other | 1.0% | |
| Wood | Gore | 37.4% | |
| Bush | 60.3% | |
| Nader | 1.7% | |
| Other | 0.5% | |
| Wyoming | Gore | 54.4% | |
| Bush | 44.1% | |
| Nader | 0.8% | |
| Other | 0.6% | |