2000 Senatorial General Election Data Graphs - West Virginia
by County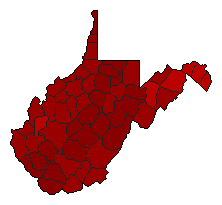
| Barbour | Byrd | 79.7% | |
| Gallaher | 19.1% | |
| 0.0% | |
| Other | 1.2% | |
| Berkeley | Byrd | 65.7% | |
| Gallaher | 32.4% | |
| 0.0% | |
| Other | 1.9% | |
| Boone | Byrd | 86.9% | |
| Gallaher | 11.7% | |
| 0.0% | |
| Other | 1.4% | |
| Braxton | Byrd | 82.7% | |
| Gallaher | 16.3% | |
| 0.0% | |
| Other | 1.0% | |
| Brooke | Byrd | 82.8% | |
| Gallaher | 15.5% | |
| 0.0% | |
| Other | 1.6% | |
| Cabell | Byrd | 76.2% | |
| Gallaher | 21.4% | |
| 0.0% | |
| Other | 2.3% | |
| Calhoun | Byrd | 77.7% | |
| Gallaher | 19.8% | |
| 0.0% | |
| Other | 2.5% | |
| Clay | Byrd | 80.6% | |
| Gallaher | 17.7% | |
| 0.0% | |
| Other | 1.7% | |
| Doddridge | Byrd | 72.5% | |
| Gallaher | 25.3% | |
| 0.0% | |
| Other | 2.2% | |
| Fayette | Byrd | 82.5% | |
| Gallaher | 15.7% | |
| 0.0% | |
| Other | 1.8% | |
| Gilmer | Byrd | 79.2% | |
| Gallaher | 17.5% | |
| 0.0% | |
| Other | 3.4% | |
| Grant | Byrd | 63.0% | |
| Gallaher | 36.0% | |
| 0.0% | |
| Other | 1.0% | |
| Greenbrier | Byrd | 77.7% | |
| Gallaher | 19.4% | |
| 0.0% | |
| Other | 2.8% | |
| Hampshire | Byrd | 66.4% | |
| Gallaher | 31.3% | |
| 0.0% | |
| Other | 2.3% | |
| Hancock | Byrd | 81.3% | |
| Gallaher | 16.9% | |
| 0.0% | |
| Other | 1.8% | |
| Hardy | Byrd | 77.2% | |
| Gallaher | 21.7% | |
| 0.0% | |
| Other | 1.1% | |
| Harrison | Byrd | 84.2% | |
| Gallaher | 14.1% | |
| 0.0% | |
| Other | 1.8% | |
| Jackson | Byrd | 74.0% | |
| Gallaher | 23.9% | |
| 0.0% | |
| Other | 2.1% | |
| Jefferson | Byrd | 69.8% | |
| Gallaher | 28.1% | |
| 0.0% | |
| Other | 2.1% | |
| Kanawha | Byrd | 75.7% | |
| Gallaher | 22.1% | |
| 0.0% | |
| Other | 2.2% | |
| Lewis | Byrd | 81.9% | |
| Gallaher | 14.8% | |
| 0.0% | |
| Other | 3.3% | |
| Lincoln | Byrd | 78.2% | |
| Gallaher | 19.8% | |
| 0.0% | |
| Other | 2.0% | |
| Logan | Byrd | 86.9% | |
| Gallaher | 11.9% | |
| 0.0% | |
| Other | 1.1% | |
| McDowell | Byrd | 89.7% | |
| Gallaher | 7.3% | |
| 0.0% | |
| Other | 3.0% | |
| Marion | Byrd | 85.7% | |
| Gallaher | 12.9% | |
| 0.0% | |
| Other | 1.4% | |
| Marshall | Byrd | 78.2% | |
| Gallaher | 19.8% | |
| 0.0% | |
| Other | 2.1% | |
| Mason | Byrd | 78.7% | |
| Gallaher | 18.4% | |
| 0.0% | |
| Other | 2.9% | |
| Mercer | Byrd | 72.7% | |
| Gallaher | 25.1% | |
| 0.0% | |
| Other | 2.2% | |
| Mineral | Byrd | 74.4% | |
| Gallaher | 24.1% | |
| 0.0% | |
| Other | 1.6% | |
| Mingo | Byrd | 87.4% | |
| Gallaher | 11.9% | |
| 0.0% | |
| Other | 0.7% | |
| Monongalia | Byrd | 80.1% | |
| Gallaher | 16.4% | |
| 0.0% | |
| Other | 3.5% | |
| Monroe | Byrd | 73.9% | |
| Gallaher | 23.7% | |
| 0.0% | |
| Other | 2.3% | |
| Morgan | Byrd | 63.5% | |
| Gallaher | 35.5% | |
| 0.0% | |
| Other | 0.9% | |
| Nicholas | Byrd | 81.0% | |
| Gallaher | 17.0% | |
| 0.0% | |
| Other | 1.9% | |
| Ohio | Byrd | 77.8% | |
| Gallaher | 19.9% | |
| 0.0% | |
| Other | 2.3% | |
| Pendleton | Byrd | 75.4% | |
| Gallaher | 23.7% | |
| 0.0% | |
| Other | 0.9% | |
| Pleasants | Byrd | 79.3% | |
| Gallaher | 19.6% | |
| 0.0% | |
| Other | 1.2% | |
| Pocahontas | Byrd | 80.9% | |
| Gallaher | 16.9% | |
| 0.0% | |
| Other | 2.2% | |
| Preston | Byrd | 78.4% | |
| Gallaher | 19.3% | |
| 0.0% | |
| Other | 2.2% | |
| Putnam | Byrd | 69.8% | |
| Gallaher | 28.3% | |
| 0.0% | |
| Other | 1.9% | |
| Raleigh | Byrd | 76.7% | |
| Gallaher | 20.1% | |
| 0.0% | |
| Other | 3.2% | |
| Randolph | Byrd | 80.8% | |
| Gallaher | 16.8% | |
| 0.0% | |
| Other | 2.4% | |
| Ritchie | Byrd | 74.2% | |
| Gallaher | 23.5% | |
| 0.0% | |
| Other | 2.3% | |
| Roane | Byrd | 74.5% | |
| Gallaher | 23.2% | |
| 0.0% | |
| Other | 2.3% | |
| Summers | Byrd | 79.2% | |
| Gallaher | 18.0% | |
| 0.0% | |
| Other | 2.8% | |
| Taylor | Byrd | 81.3% | |
| Gallaher | 17.3% | |
| 0.0% | |
| Other | 1.4% | |
| Tucker | Byrd | 82.7% | |
| Gallaher | 15.6% | |
| 0.0% | |
| Other | 1.7% | |
| Tyler | Byrd | 76.9% | |
| Gallaher | 21.0% | |
| 0.0% | |
| Other | 2.0% | |
| Upshur | Byrd | 76.3% | |
| Gallaher | 22.0% | |
| 0.0% | |
| Other | 1.7% | |
| Wayne | Byrd | 78.5% | |
| Gallaher | 20.5% | |
| 0.0% | |
| Other | 1.1% | |
| Webster | Byrd | 87.5% | |
| Gallaher | 10.7% | |
| 0.0% | |
| Other | 1.8% | |
| Wetzel | Byrd | 79.2% | |
| Gallaher | 19.5% | |
| 0.0% | |
| Other | 1.4% | |
| Wirt | Byrd | 75.0% | |
| Gallaher | 23.6% | |
| 0.0% | |
| Other | 1.4% | |
| Wood | Byrd | 75.6% | |
| Gallaher | 22.3% | |
| 0.0% | |
| Other | 2.2% | |
| Wyoming | Byrd | 82.3% | |
| Gallaher | 14.7% | |
| 0.0% | |
| Other | 3.0% | |