2002 Referendum General Election Data Graphs - Massachusetts
by CountyData for this Contest was Contributed by on 2008-06-21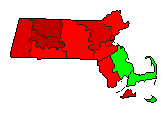
| Barnstable | No | 45.4% | |
| Yes | 45.6% | |
| Other | 9.0% | |
| Berkshire | No | 50.7% | |
| Yes | 31.3% | |
| Other | 18.0% | |
| Bristol | No | 44.1% | |
| Yes | 42.2% | |
| Other | 13.7% | |
| Dukes | No | 50.5% | |
| Yes | 36.6% | |
| Other | 12.9% | |
| Essex | No | 45.3% | |
| Yes | 44.4% | |
| Other | 10.2% | |
| Franklin | No | 63.3% | |
| Yes | 29.5% | |
| Other | 7.2% | |
| Hampden | No | 48.2% | |
| Yes | 39.8% | |
| Other | 12.0% | |
| Hampshire | No | 60.1% | |
| Yes | 29.9% | |
| Other | 10.0% | |
| Middlesex | No | 51.7% | |
| Yes | 38.3% | |
| Other | 10.0% | |
| Nantucket | No | 37.7% | |
| Yes | 53.3% | |
| Other | 9.1% | |
| Norfolk | No | 48.8% | |
| Yes | 40.3% | |
| Other | 10.9% | |
| Plymouth | No | 45.0% | |
| Yes | 45.8% | |
| Other | 9.2% | |
| Suffolk | No | 46.1% | |
| Yes | 28.3% | |
| Other | 25.6% | |
| Worcester | No | 46.1% | |
| Yes | 43.3% | |
| Other | 10.6% | |