2002 Gubernatorial General Election Data Graphs - Minnesota
Note: The Google advertisement links below may advocate political positions that this site does not endorse.
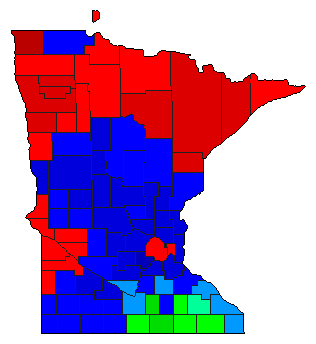
Map

AitkinMoe38.6%
 
Pawlenty42.0%
 
Penny16.9%
 
Other2.5%


AnokaMoe32.8%
 
Pawlenty51.2%
 
Penny13.8%
 
Other2.3%


BeckerMoe40.8%
 
Pawlenty46.6%
 
Penny10.6%
 
Other2.0%


BeltramiMoe44.8%
 
Pawlenty42.6%
 
Penny8.3%
 
Other4.2%


BentonMoe32.3%
 
Pawlenty48.6%
 
Penny15.9%
 
Other3.2%


Big StoneMoe44.4%
 
Pawlenty41.6%
 
Penny11.7%
 
Other2.2%


Blue EarthMoe26.4%
 
Pawlenty37.2%
 
Penny33.3%
 
Other3.1%


BrownMoe24.0%
 
Pawlenty51.3%
 
Penny22.8%
 
Other1.9%


CarltonMoe57.6%
 
Pawlenty30.0%
 
Penny10.5%
 
Other1.9%


CarverMoe22.6%
 
Pawlenty61.6%
 
Penny13.9%
 
Other1.9%


CassMoe33.5%
 
Pawlenty49.0%
 
Penny14.8%
 
Other2.8%


ChippewaMoe40.8%
 
Pawlenty38.4%
 
Penny19.1%
 
Other1.7%


ChisagoMoe30.7%
 
Pawlenty53.7%
 
Penny13.1%
 
Other2.5%


ClayMoe48.8%
 
Pawlenty40.6%
 
Penny8.4%
 
Other2.2%


ClearwaterMoe46.6%
 
Pawlenty43.6%
 
Penny7.5%
 
Other2.3%


CookMoe43.3%
 
Pawlenty33.9%
 
Penny15.6%
 
Other7.2%


CottonwoodMoe32.6%
 
Pawlenty47.5%
 
Penny17.9%
 
Other2.0%


Crow WingMoe33.8%
 
Pawlenty48.8%
 
Penny14.9%
 
Other2.4%


DakotaMoe31.5%
 
Pawlenty53.4%
 
Penny13.1%
 
Other2.1%


DodgeMoe17.1%
 
Pawlenty39.6%
 
Penny41.8%
 
Other1.5%


DouglasMoe31.1%
 
Pawlenty52.5%
 
Penny14.3%
 
Other2.1%


FaribaultMoe15.9%
 
Pawlenty34.5%
 
Penny48.4%
 
Other1.2%


FillmoreMoe18.7%
 
Pawlenty31.9%
 
Penny47.8%
 
Other1.6%


FreebornMoe17.9%
 
Pawlenty28.8%
 
Penny52.0%
 
Other1.3%


GoodhueMoe25.3%
 
Pawlenty42.4%
 
Penny30.3%
 
Other1.9%


GrantMoe40.0%
 
Pawlenty44.6%
 
Penny13.2%
 
Other2.3%


HennepinMoe41.3%
 
Pawlenty40.7%
 
Penny13.8%
 
Other4.2%


HoustonMoe23.3%
 
Pawlenty39.0%
 
Penny35.6%
 
Other2.0%


HubbardMoe35.7%
 
Pawlenty50.2%
 
Penny11.1%
 
Other2.9%


IsantiMoe32.1%
 
Pawlenty53.0%
 
Penny12.3%
 
Other2.6%


ItascaMoe50.8%
 
Pawlenty34.7%
 
Penny11.6%
 
Other2.8%


JacksonMoe34.5%
 
Pawlenty43.4%
 
Penny19.8%
 
Other2.4%


KanabecMoe33.7%
 
Pawlenty51.1%
 
Penny12.6%
 
Other2.6%


KandiyohiMoe38.2%
 
Pawlenty46.3%
 
Penny13.8%
 
Other1.7%


KittsonMoe60.6%
 
Pawlenty30.3%
 
Penny7.8%
 
Other1.3%


KoochichingMoe47.9%
 
Pawlenty36.6%
 
Penny13.0%
 
Other2.5%


Lac Qui ParleMoe44.5%
 
Pawlenty37.4%
 
Penny15.9%
 
Other2.2%


LakeMoe55.3%
 
Pawlenty29.7%
 
Penny12.1%
 
Other2.9%


Lake of the WoodsMoe44.0%
 
Pawlenty41.4%
 
Penny11.8%
 
Other2.8%


Le SueurMoe23.8%
 
Pawlenty42.5%
 
Penny31.6%
 
Other2.1%


LincolnMoe42.2%
 
Pawlenty40.9%
 
Penny14.4%
 
Other2.6%


LyonMoe33.7%
 
Pawlenty49.2%
 
Penny14.9%
 
Other2.2%


McLeodMoe25.0%
 
Pawlenty55.8%
 
Penny16.9%
 
Other2.4%


MahnomenMoe46.9%
 
Pawlenty39.5%
 
Penny9.6%
 
Other3.9%


MarshallMoe48.8%
 
Pawlenty41.1%
 
Penny8.3%
 
Other1.8%


MartinMoe25.5%
 
Pawlenty47.3%
 
Penny25.6%
 
Other1.7%


MeekerMoe30.2%
 
Pawlenty50.1%
 
Penny16.9%
 
Other2.7%


Mille LacsMoe31.5%
 
Pawlenty51.0%
 
Penny14.8%
 
Other2.6%


MorrisonMoe28.1%
 
Pawlenty55.2%
 
Penny14.2%
 
Other2.6%


MowerMoe27.0%
 
Pawlenty28.8%
 
Penny42.5%
 
Other1.7%


MurrayMoe37.3%
 
Pawlenty44.0%
 
Penny15.8%
 
Other2.8%


NicolletMoe29.1%
 
Pawlenty40.0%
 
Penny28.6%
 
Other2.3%


NoblesMoe37.5%
 
Pawlenty44.8%
 
Penny15.2%
 
Other2.5%


NormanMoe57.7%
 
Pawlenty32.8%
 
Penny8.4%
 
Other1.2%


OlmstedMoe19.7%
 
Pawlenty39.4%
 
Penny39.4%
 
Other1.5%


Otter TailMoe34.9%
 
Pawlenty52.5%
 
Penny10.6%
 
Other2.0%


PenningtonMoe50.0%
 
Pawlenty38.9%
 
Penny9.3%
 
Other1.8%


PineMoe39.8%
 
Pawlenty43.6%
 
Penny13.6%
 
Other3.0%


PipestoneMoe32.8%
 
Pawlenty48.4%
 
Penny16.0%
 
Other2.8%


PolkMoe56.4%
 
Pawlenty35.7%
 
Penny6.6%
 
Other1.3%


PopeMoe39.3%
 
Pawlenty43.3%
 
Penny14.7%
 
Other2.7%


RamseyMoe45.3%
 
Pawlenty38.3%
 
Penny12.2%
 
Other4.2%


Red LakeMoe51.7%
 
Pawlenty37.5%
 
Penny9.0%
 
Other1.8%


RedwoodMoe27.1%
 
Pawlenty52.6%
 
Penny18.3%
 
Other2.1%


RenvilleMoe35.3%
 
Pawlenty44.3%
 
Penny18.3%
 
Other2.1%


RiceMoe33.8%
 
Pawlenty37.6%
 
Penny24.3%
 
Other4.3%


RockMoe38.6%
 
Pawlenty49.0%
 
Penny10.1%
 
Other2.3%


RoseauMoe42.5%
 
Pawlenty49.7%
 
Penny5.5%
 
Other2.2%


St. LouisMoe59.9%
 
Pawlenty26.5%
 
Penny10.6%
 
Other3.0%


ScottMoe24.4%
 
Pawlenty58.3%
 
Penny15.4%
 
Other2.0%


SherburneMoe26.8%
 
Pawlenty58.2%
 
Penny12.7%
 
Other2.3%


SibleyMoe23.8%
 
Pawlenty50.8%
 
Penny23.4%
 
Other1.9%


StearnsMoe30.5%
 
Pawlenty50.7%
 
Penny15.2%
 
Other3.6%


SteeleMoe16.7%
 
Pawlenty41.1%
 
Penny40.6%
 
Other1.6%


StevensMoe35.9%
 
Pawlenty45.8%
 
Penny13.1%
 
Other5.3%


SwiftMoe47.6%
 
Pawlenty37.3%
 
Penny13.2%
 
Other1.9%


ToddMoe31.1%
 
Pawlenty51.9%
 
Penny14.3%
 
Other2.7%


TraverseMoe43.4%
 
Pawlenty41.4%
 
Penny13.3%
 
Other2.0%


WabashaMoe21.2%
 
Pawlenty39.8%
 
Penny37.2%
 
Other1.8%


WadenaMoe32.9%
 
Pawlenty53.4%
 
Penny11.1%
 
Other2.6%


WasecaMoe10.3%
 
Pawlenty29.9%
 
Penny58.5%
 
Other1.3%


WashingtonMoe32.7%
 
Pawlenty52.7%
 
Penny12.3%
 
Other2.3%


WatonwanMoe29.1%
 
Pawlenty40.2%
 
Penny28.6%
 
Other2.1%


WilkinMoe37.9%
 
Pawlenty51.0%
 
Penny9.1%
 
Other2.1%


WinonaMoe27.5%
 
Pawlenty37.5%
 
Penny31.0%
 
Other4.0%


WrightMoe26.8%
 
Pawlenty57.3%
 
Penny13.5%
 
Other2.4%


Yellow MedicineMoe42.2%
 
Pawlenty40.8%
 
Penny14.9%
 
Other2.1%


National DataGraph for 2002 - Minnesota Results for 2002

Login

Terms of Use - DCMA Policy - Privacy Policy and Cookies


© Dave Leip's Atlas of U.S. Elections, LLC 2019 All Rights Reserved