2002 Lt. Gubernatorial General Election Data Graphs - Vermont
by CountyData for this Contest was Contributed by on 2012-01-13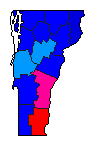
| Addison | Shumlin | 32.0% | |
| Dubie | 38.5% | |
| Pollina | 25.6% | |
| Other | 4.0% | |
| Bennington | Shumlin | 39.5% | |
| Dubie | 43.8% | |
| Pollina | 12.8% | |
| Other | 3.8% | |
| Caledonia | Shumlin | 21.8% | |
| Dubie | 49.9% | |
| Pollina | 27.0% | |
| Other | 1.3% | |
| Chittenden | Shumlin | 32.3% | |
| Dubie | 42.5% | |
| Pollina | 24.3% | |
| Other | 0.9% | |
| Essex | Shumlin | 21.7% | |
| Dubie | 56.5% | |
| Pollina | 17.4% | |
| Other | 4.4% | |
| Franklin | Shumlin | 30.2% | |
| Dubie | 46.0% | |
| Pollina | 22.2% | |
| Other | 1.6% | |
| Grand Isle | Shumlin | 29.1% | |
| Dubie | 47.1% | |
| Pollina | 22.3% | |
| Other | 1.4% | |
| Lamoille | Shumlin | 26.3% | |
| Dubie | 41.4% | |
| Pollina | 30.6% | |
| Other | 1.7% | |
| Orange | Shumlin | 28.2% | |
| Dubie | 42.5% | |
| Pollina | 27.3% | |
| Other | 2.0% | |
| Orleans | Shumlin | 21.1% | |
| Dubie | 45.0% | |
| Pollina | 32.3% | |
| Other | 1.6% | |
| Rutland | Shumlin | 31.5% | |
| Dubie | 46.1% | |
| Pollina | 20.4% | |
| Other | 2.1% | |
| Washington | Shumlin | 27.8% | |
| Dubie | 36.5% | |
| Pollina | 34.5% | |
| Other | 1.1% | |
| Windham | Shumlin | 45.2% | |
| Dubie | 28.9% | |
| Pollina | 22.9% | |
| Other | 2.9% | |
| Windsor | Shumlin | 39.8% | |
| Dubie | 35.6% | |
| Pollina | 22.5% | |
| Other | 2.1% | |