2003 Lt. Gubernatorial Open Primary Election Data Graphs - Louisiana
Note: The Google advertisement links below may advocate political positions that this site does not endorse.
Data for this Contest was Contributed by on 2007-01-04
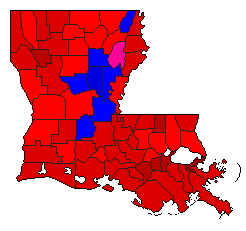
Map

AcadiaLandrieu54.1%
 
Holloway25.9%
 
Other19.9%


AllenLandrieu51.6%
 
Holloway37.6%
 
Other10.8%


AscensionLandrieu45.1%
 
Holloway23.8%
 
Other31.1%


AssumptionLandrieu63.3%
 
Holloway10.9%
 
Other25.9%


AvoyellesLandrieu42.5%
 
Holloway42.6%
 
Other15.0%


BeauregardLandrieu44.5%
 
Holloway31.0%
 
Other24.5%


BienvilleLandrieu59.0%
 
Holloway17.7%
 
Other23.3%


BossierLandrieu43.9%
 
Holloway21.7%
 
Other34.3%


CaddoLandrieu55.2%
 
Holloway16.0%
 
Other28.7%


CalcasieuLandrieu53.1%
 
Holloway19.2%
 
Other27.6%


CaldwellLandrieu37.7%
 
Holloway40.6%
 
Other21.7%


CameronLandrieu54.3%
 
Holloway18.6%
 
Other27.1%


CatahoulaLandrieu38.8%
 
Holloway44.8%
 
Other16.4%


ClaiborneLandrieu53.5%
 
Holloway21.3%
 
Other25.2%


ConcordiaLandrieu49.2%
 
Holloway34.9%
 
Other15.9%


De SotoLandrieu57.8%
 
Holloway15.7%
 
Other26.5%


East Baton RougeLandrieu46.9%
 
Holloway18.7%
 
Other34.4%


East CarrollLandrieu57.7%
 
Holloway26.1%
 
Other16.2%


East FelicianaLandrieu50.8%
 
Holloway26.8%
 
Other22.4%


EvangelineLandrieu41.0%
 
Holloway46.5%
 
Other12.5%


FranklinLandrieu39.8%
 
Holloway38.2%
 
Other21.9%


GrantLandrieu34.0%
 
Holloway45.8%
 
Other20.1%


IberiaLandrieu52.9%
 
Holloway22.3%
 
Other24.8%


IbervilleLandrieu58.0%
 
Holloway22.1%
 
Other20.0%


JacksonLandrieu48.7%
 
Holloway31.7%
 
Other19.6%


JeffersonLandrieu54.2%
 
Holloway9.0%
 
Other36.7%


Jefferson DavisLandrieu49.5%
 
Holloway26.2%
 
Other24.3%


LafayetteLandrieu46.9%
 
Holloway23.9%
 
Other29.2%


LafourcheLandrieu58.4%
 
Holloway9.1%
 
Other32.5%


La SalleLandrieu26.1%
 
Holloway56.1%
 
Other17.8%


LincolnLandrieu43.7%
 
Holloway31.8%
 
Other24.5%


LivingstonLandrieu40.3%
 
Holloway26.4%
 
Other33.3%


MadisonLandrieu55.6%
 
Holloway30.0%
 
Other14.4%


MorehouseLandrieu48.3%
 
Holloway28.3%
 
Other23.5%


NatchitochesLandrieu56.6%
 
Holloway24.6%
 
Other18.8%


OrleansLandrieu79.0%
 
Holloway3.6%
 
Other17.3%


OuachitaLandrieu43.6%
 
Holloway29.6%
 
Other26.7%


PlaqueminesLandrieu55.3%
 
Holloway8.6%
 
Other36.1%


Pointe CoupeeLandrieu55.2%
 
Holloway29.8%
 
Other15.1%


RapidesLandrieu41.3%
 
Holloway38.1%
 
Other20.6%


Red RiverLandrieu61.3%
 
Holloway17.4%
 
Other21.3%


RichlandLandrieu45.4%
 
Holloway33.6%
 
Other21.1%


SabineLandrieu49.3%
 
Holloway26.9%
 
Other23.9%


St. BernardLandrieu55.0%
 
Holloway7.8%
 
Other37.2%


St. CharlesLandrieu56.7%
 
Holloway11.1%
 
Other32.2%


St. HelenaLandrieu60.2%
 
Holloway21.4%
 
Other18.4%


St. JamesLandrieu68.6%
 
Holloway15.0%
 
Other16.4%


St. John the BaptistLandrieu61.3%
 
Holloway16.3%
 
Other22.5%


St. LandryLandrieu51.8%
 
Holloway34.4%
 
Other13.7%


St. MartinLandrieu57.8%
 
Holloway21.2%
 
Other21.0%


St. MaryLandrieu55.2%
 
Holloway16.9%
 
Other27.9%


St. TammanyLandrieu42.4%
 
Holloway15.1%
 
Other42.5%


TangipahoaLandrieu44.9%
 
Holloway17.4%
 
Other37.7%


TensasLandrieu52.6%
 
Holloway32.2%
 
Other15.2%


TerrebonneLandrieu54.1%
 
Holloway9.1%
 
Other36.8%


UnionLandrieu40.4%
 
Holloway36.3%
 
Other23.3%


VermilionLandrieu58.9%
 
Holloway20.8%
 
Other20.3%


VernonLandrieu41.4%
 
Holloway39.9%
 
Other18.7%


WashingtonLandrieu57.9%
 
Holloway13.2%
 
Other28.8%


WebsterLandrieu53.3%
 
Holloway18.0%
 
Other28.7%


West Baton RougeLandrieu51.3%
 
Holloway27.5%
 
Other21.2%


West CarrollLandrieu37.2%
 
Holloway40.1%
 
Other22.7%


West FelicianaLandrieu50.3%
 
Holloway21.1%
 
Other28.7%


WinnLandrieu44.7%
 
Holloway34.9%
 
Other20.4%


National DataGraph for 2003 - Louisiana Results for 2003

Login

Terms of Use - DCMA Policy - Privacy Policy and Cookies


© Dave Leip's Atlas of U.S. Elections, LLC 2019 All Rights Reserved