2004 Gubernatorial Republican Primary Election Data Graphs - Missouri
Note: The Google advertisement links below may advocate political positions that this site does not endorse.
Data for this Contest was Contributed by on 2007-04-12
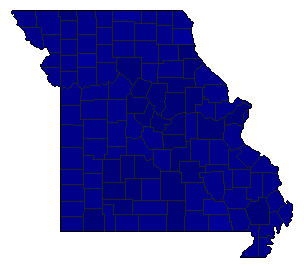
Map

Adair0.0%
 
Blunt89.6%
 
Other10.4%


Andrew0.0%
 
Blunt87.4%
 
Other12.6%


Atchison0.0%
 
Blunt82.4%
 
Other17.6%


Audrain0.0%
 
Blunt92.3%
 
Other7.7%


Barry0.0%
 
Blunt91.7%
 
Other8.3%


Barton0.0%
 
Blunt86.7%
 
Other13.3%


Bates0.0%
 
Blunt81.7%
 
Other18.3%


Benton0.0%
 
Blunt85.3%
 
Other14.7%


Bollinger0.0%
 
Blunt85.7%
 
Other14.3%


Boone0.0%
 
Blunt94.5%
 
Other5.5%


Buchanan0.0%
 
Blunt84.2%
 
Other15.8%


Butler0.0%
 
Blunt82.5%
 
Other17.5%


Caldwell0.0%
 
Blunt78.6%
 
Other21.4%


Callaway0.0%
 
Blunt93.6%
 
Other6.4%


Camden0.0%
 
Blunt88.4%
 
Other11.6%


Cape Girardeau0.0%
 
Blunt86.0%
 
Other14.0%


Carroll0.0%
 
Blunt86.5%
 
Other13.5%


Carter0.0%
 
Blunt79.5%
 
Other20.5%


Cass0.0%
 
Blunt85.4%
 
Other14.6%


Cedar0.0%
 
Blunt87.9%
 
Other12.1%


Chariton0.0%
 
Blunt91.9%
 
Other8.1%


Christian0.0%
 
Blunt90.9%
 
Other9.1%


Clark0.0%
 
Blunt83.0%
 
Other17.0%


Clay0.0%
 
Blunt84.1%
 
Other15.9%


Clinton0.0%
 
Blunt84.1%
 
Other15.9%


Cole0.0%
 
Blunt96.5%
 
Other3.5%


Cooper0.0%
 
Blunt90.5%
 
Other9.5%


Crawford0.0%
 
Blunt83.4%
 
Other16.6%


Dade0.0%
 
Blunt88.8%
 
Other11.2%


Dallas0.0%
 
Blunt90.1%
 
Other9.9%


Daviess0.0%
 
Blunt83.5%
 
Other16.5%


DeKalb0.0%
 
Blunt84.5%
 
Other15.5%


Dent0.0%
 
Blunt90.5%
 
Other9.5%


Douglas0.0%
 
Blunt87.9%
 
Other12.1%


Dunklin0.0%
 
Blunt86.2%
 
Other13.8%


Franklin0.0%
 
Blunt90.2%
 
Other9.8%


Gasconade0.0%
 
Blunt88.8%
 
Other11.2%


Gentry0.0%
 
Blunt88.7%
 
Other11.3%


Greene0.0%
 
Blunt94.1%
 
Other5.9%


Grundy0.0%
 
Blunt82.5%
 
Other17.5%


Harrison0.0%
 
Blunt81.2%
 
Other18.8%


Henry0.0%
 
Blunt83.7%
 
Other16.3%


Hickory0.0%
 
Blunt88.2%
 
Other11.8%


Holt0.0%
 
Blunt85.0%
 
Other15.0%


Howard0.0%
 
Blunt91.5%
 
Other8.5%


Howell0.0%
 
Blunt90.9%
 
Other9.1%


Iron0.0%
 
Blunt85.2%
 
Other14.8%


Jackson0.0%
 
Blunt83.8%
 
Other16.2%


Jasper0.0%
 
Blunt89.8%
 
Other10.2%


Jefferson0.0%
 
Blunt84.7%
 
Other15.3%


Johnson0.0%
 
Blunt82.6%
 
Other17.4%


Knox0.0%
 
Blunt88.3%
 
Other11.7%


Laclede0.0%
 
Blunt90.1%
 
Other9.9%


Lafayette0.0%
 
Blunt82.9%
 
Other17.1%


Lawrence0.0%
 
Blunt89.0%
 
Other11.0%


Lewis0.0%
 
Blunt77.8%
 
Other22.2%


Lincoln0.0%
 
Blunt86.4%
 
Other13.6%


Linn0.0%
 
Blunt86.5%
 
Other13.5%


Livingston0.0%
 
Blunt87.3%
 
Other12.7%


McDonald0.0%
 
Blunt88.2%
 
Other11.8%


Macon0.0%
 
Blunt88.6%
 
Other11.4%


Madison0.0%
 
Blunt84.1%
 
Other15.9%


Maries0.0%
 
Blunt92.9%
 
Other7.1%


Marion0.0%
 
Blunt91.3%
 
Other8.7%


Mercer0.0%
 
Blunt87.6%
 
Other12.4%


Miller0.0%
 
Blunt89.2%
 
Other10.8%


Mississippi0.0%
 
Blunt89.8%
 
Other10.2%


Moniteau0.0%
 
Blunt91.8%
 
Other8.2%


Monroe0.0%
 
Blunt88.1%
 
Other11.9%


Montgomery0.0%
 
Blunt93.6%
 
Other6.4%


Morgan0.0%
 
Blunt88.1%
 
Other11.9%


New Madrid0.0%
 
Blunt86.3%
 
Other13.7%


Newton0.0%
 
Blunt87.4%
 
Other12.6%


Nodaway0.0%
 
Blunt83.1%
 
Other16.9%


Oregon0.0%
 
Blunt81.0%
 
Other19.0%


Osage0.0%
 
Blunt94.6%
 
Other5.4%


Ozark0.0%
 
Blunt84.6%
 
Other15.4%


Pemiscot0.0%
 
Blunt83.2%
 
Other16.8%


Perry0.0%
 
Blunt83.2%
 
Other16.8%


Pettis0.0%
 
Blunt87.8%
 
Other12.2%


Phelps0.0%
 
Blunt91.7%
 
Other8.3%


Pike0.0%
 
Blunt87.6%
 
Other12.4%


Platte0.0%
 
Blunt85.5%
 
Other14.5%


Polk0.0%
 
Blunt90.5%
 
Other9.5%


Pulaski0.0%
 
Blunt86.6%
 
Other13.4%


Putnam0.0%
 
Blunt77.2%
 
Other22.8%


Ralls0.0%
 
Blunt90.8%
 
Other9.2%


Randolph0.0%
 
Blunt89.7%
 
Other10.3%


Ray0.0%
 
Blunt81.4%
 
Other18.6%


Reynolds0.0%
 
Blunt83.3%
 
Other16.7%


Ripley0.0%
 
Blunt79.1%
 
Other20.9%


St. Charles0.0%
 
Blunt89.6%
 
Other10.4%


St. Clair0.0%
 
Blunt88.8%
 
Other11.2%


Ste. Genevieve0.0%
 
Blunt83.6%
 
Other16.4%


St. Francois0.0%
 
Blunt87.1%
 
Other12.9%


St. Louis0.0%
 
Blunt90.4%
 
Other9.6%


Saline0.0%
 
Blunt86.9%
 
Other13.1%


Schuyler0.0%
 
Blunt86.3%
 
Other13.7%


Scotland0.0%
 
Blunt82.8%
 
Other17.2%


Scott0.0%
 
Blunt89.4%
 
Other10.6%


Shannon0.0%
 
Blunt87.0%
 
Other13.0%


Shelby0.0%
 
Blunt89.1%
 
Other10.9%


Stoddard0.0%
 
Blunt91.6%
 
Other8.4%


Stone0.0%
 
Blunt87.7%
 
Other12.3%


Sullivan0.0%
 
Blunt83.8%
 
Other16.2%


Taney0.0%
 
Blunt87.5%
 
Other12.5%


Texas0.0%
 
Blunt90.8%
 
Other9.2%


Vernon0.0%
 
Blunt85.9%
 
Other14.1%


Warren0.0%
 
Blunt88.8%
 
Other11.2%


Washington0.0%
 
Blunt84.6%
 
Other15.4%


Wayne0.0%
 
Blunt88.1%
 
Other11.9%


Webster0.0%
 
Blunt90.2%
 
Other9.8%


Worth0.0%
 
Blunt95.7%
 
Other4.3%


Wright0.0%
 
Blunt88.5%
 
Other11.5%


City

St. Louis0.0%
 
Blunt83.7%
 
Other16.3%


National DataGraph for 2004 - Missouri Results for 2004

Login

Terms of Use - DCMA Policy - Privacy Policy and Cookies


© Dave Leip's Atlas of U.S. Elections, LLC 2019 All Rights Reserved