2004 Attorney General General Election Data Graphs - Missouri
Note: The Google advertisement links below may advocate political positions that this site does not endorse.
Data for this Contest was Contributed by on 2007-01-31
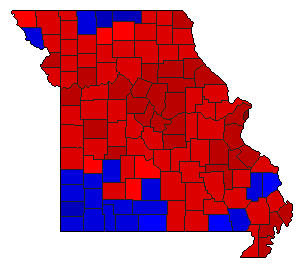
Map

AdairNixon56.1%
 
Byrd40.7%
 
Other3.2%


AndrewNixon56.2%
 
Byrd41.8%
 
Other2.0%


AtchisonNixon50.0%
 
Byrd47.2%
 
Other2.9%


AudrainNixon65.8%
 
Byrd32.5%
 
Other1.7%


BarryNixon46.0%
 
Byrd51.6%
 
Other2.5%


BartonNixon40.0%
 
Byrd57.3%
 
Other2.7%


BatesNixon57.2%
 
Byrd39.8%
 
Other3.0%


BentonNixon55.4%
 
Byrd42.1%
 
Other2.5%


BollingerNixon43.2%
 
Byrd55.3%
 
Other1.5%


BooneNixon66.9%
 
Byrd30.4%
 
Other2.7%


BuchananNixon62.3%
 
Byrd34.6%
 
Other3.1%


ButlerNixon42.3%
 
Byrd54.5%
 
Other3.2%


CaldwellNixon52.5%
 
Byrd44.4%
 
Other3.1%


CallawayNixon63.5%
 
Byrd34.0%
 
Other2.4%


CamdenNixon50.8%
 
Byrd47.4%
 
Other1.8%


Cape GirardeauNixon47.6%
 
Byrd49.8%
 
Other2.6%


CarrollNixon51.6%
 
Byrd45.3%
 
Other3.1%


CarterNixon50.6%
 
Byrd47.5%
 
Other1.9%


CassNixon50.7%
 
Byrd46.5%
 
Other2.9%


CedarNixon49.0%
 
Byrd48.0%
 
Other3.1%


CharitonNixon59.5%
 
Byrd39.0%
 
Other1.5%


ChristianNixon46.0%
 
Byrd51.9%
 
Other2.1%


ClarkNixon63.9%
 
Byrd32.8%
 
Other3.3%


ClayNixon55.2%
 
Byrd41.5%
 
Other3.3%


ClintonNixon57.4%
 
Byrd39.4%
 
Other3.3%


ColeNixon65.8%
 
Byrd32.4%
 
Other1.8%


CooperNixon60.1%
 
Byrd38.1%
 
Other1.8%


CrawfordNixon55.9%
 
Byrd41.0%
 
Other3.1%


DadeNixon43.0%
 
Byrd55.6%
 
Other1.4%


DallasNixon54.1%
 
Byrd43.7%
 
Other2.2%


DaviessNixon56.5%
 
Byrd40.1%
 
Other3.3%


DeKalbNixon53.5%
 
Byrd43.4%
 
Other3.1%


DentNixon52.8%
 
Byrd44.4%
 
Other2.7%


DouglasNixon41.3%
 
Byrd55.5%
 
Other3.2%


DunklinNixon58.3%
 
Byrd39.1%
 
Other2.6%


FranklinNixon59.2%
 
Byrd38.5%
 
Other2.3%


GasconadeNixon50.5%
 
Byrd47.4%
 
Other2.2%


GentryNixon58.3%
 
Byrd38.2%
 
Other3.6%


GreeneNixon51.9%
 
Byrd45.5%
 
Other2.5%


GrundyNixon49.2%
 
Byrd46.9%
 
Other3.9%


HarrisonNixon42.4%
 
Byrd56.0%
 
Other1.6%


HenryNixon60.1%
 
Byrd37.0%
 
Other2.9%


HickoryNixon60.2%
 
Byrd37.6%
 
Other2.2%


HoltNixon47.1%
 
Byrd50.8%
 
Other2.0%


HowardNixon67.8%
 
Byrd29.8%
 
Other2.4%


HowellNixon51.2%
 
Byrd46.0%
 
Other2.8%


IronNixon66.7%
 
Byrd30.5%
 
Other2.9%


JacksonNixon65.0%
 
Byrd32.4%
 
Other2.6%


JasperNixon38.5%
 
Byrd58.4%
 
Other3.1%


JeffersonNixon65.4%
 
Byrd32.4%
 
Other2.2%


JohnsonNixon51.5%
 
Byrd45.5%
 
Other3.0%


KnoxNixon57.2%
 
Byrd41.0%
 
Other1.8%


LacledeNixon49.8%
 
Byrd48.5%
 
Other1.7%


LafayetteNixon56.0%
 
Byrd41.4%
 
Other2.6%


LawrenceNixon45.5%
 
Byrd52.2%
 
Other2.3%


LewisNixon56.7%
 
Byrd40.0%
 
Other3.3%


LincolnNixon59.5%
 
Byrd38.1%
 
Other2.4%


LinnNixon58.9%
 
Byrd39.1%
 
Other2.0%


LivingstonNixon55.2%
 
Byrd42.0%
 
Other2.8%


McDonaldNixon38.3%
 
Byrd57.6%
 
Other4.1%


MaconNixon56.8%
 
Byrd41.3%
 
Other2.0%


MadisonNixon58.9%
 
Byrd38.9%
 
Other2.2%


MariesNixon63.0%
 
Byrd34.6%
 
Other2.4%


MarionNixon55.8%
 
Byrd41.7%
 
Other2.5%


MercerNixon38.0%
 
Byrd60.1%
 
Other1.9%


MillerNixon50.7%
 
Byrd47.2%
 
Other2.0%


MississippiNixon64.9%
 
Byrd32.6%
 
Other2.5%


MoniteauNixon62.3%
 
Byrd36.5%
 
Other1.3%


MonroeNixon63.5%
 
Byrd33.9%
 
Other2.6%


MontgomeryNixon59.1%
 
Byrd37.9%
 
Other2.9%


MorganNixon56.6%
 
Byrd41.2%
 
Other2.2%


New MadridNixon63.6%
 
Byrd34.0%
 
Other2.4%


NewtonNixon37.1%
 
Byrd60.0%
 
Other2.8%


NodawayNixon55.1%
 
Byrd41.8%
 
Other3.1%


OregonNixon56.2%
 
Byrd39.9%
 
Other3.9%


OsageNixon65.7%
 
Byrd33.0%
 
Other1.3%


OzarkNixon47.3%
 
Byrd49.4%
 
Other3.4%


PemiscotNixon62.1%
 
Byrd33.4%
 
Other4.5%


PerryNixon50.9%
 
Byrd47.0%
 
Other2.0%


PettisNixon56.1%
 
Byrd41.7%
 
Other2.2%


PhelpsNixon56.8%
 
Byrd40.0%
 
Other3.2%


PikeNixon65.6%
 
Byrd31.5%
 
Other2.8%


PlatteNixon51.8%
 
Byrd45.3%
 
Other2.9%


PolkNixon46.7%
 
Byrd50.8%
 
Other2.6%


PulaskiNixon54.9%
 
Byrd43.0%
 
Other2.1%


PutnamNixon37.2%
 
Byrd60.6%
 
Other2.2%


RallsNixon60.2%
 
Byrd37.5%
 
Other2.3%


RandolphNixon62.4%
 
Byrd35.0%
 
Other2.5%


RayNixon61.5%
 
Byrd35.8%
 
Other2.7%


ReynoldsNixon59.0%
 
Byrd38.9%
 
Other2.1%


RipleyNixon47.9%
 
Byrd48.8%
 
Other3.3%


St. CharlesNixon56.3%
 
Byrd41.9%
 
Other1.9%


St. ClairNixon57.9%
 
Byrd39.7%
 
Other2.4%


Ste. GenevieveNixon68.0%
 
Byrd29.7%
 
Other2.3%


St. FrancoisNixon63.6%
 
Byrd33.9%
 
Other2.5%


St. LouisNixon65.8%
 
Byrd32.5%
 
Other1.6%


SalineNixon68.0%
 
Byrd28.3%
 
Other3.8%


SchuylerNixon54.7%
 
Byrd42.6%
 
Other2.7%


ScotlandNixon58.6%
 
Byrd39.6%
 
Other1.8%


ScottNixon56.2%
 
Byrd41.7%
 
Other2.1%


ShannonNixon57.5%
 
Byrd40.1%
 
Other2.4%


ShelbyNixon57.1%
 
Byrd40.8%
 
Other2.1%


StoddardNixon52.5%
 
Byrd45.6%
 
Other1.9%


StoneNixon45.6%
 
Byrd52.2%
 
Other2.2%


SullivanNixon48.8%
 
Byrd48.3%
 
Other2.9%


TaneyNixon43.8%
 
Byrd53.6%
 
Other2.6%


TexasNixon56.9%
 
Byrd40.6%
 
Other2.5%


VernonNixon55.6%
 
Byrd41.8%
 
Other2.6%


WarrenNixon54.5%
 
Byrd42.7%
 
Other2.8%


WashingtonNixon65.7%
 
Byrd31.5%
 
Other2.8%


WayneNixon53.6%
 
Byrd43.9%
 
Other2.5%


WebsterNixon49.2%
 
Byrd48.6%
 
Other2.1%


WorthNixon56.0%
 
Byrd42.4%
 
Other1.6%


WrightNixon42.7%
 
Byrd55.0%
 
Other2.3%


City

St. LouisNixon83.4%
 
Byrd13.6%
 
Other3.0%


National DataGraph for 2004 - Missouri Results for 2004

Login

Terms of Use - DCMA Policy - Privacy Policy and Cookies


© Dave Leip's Atlas of U.S. Elections, LLC 2019 All Rights Reserved