2005 Lt. Gubernatorial General Election Data Graphs - Virginia
Note: The Google advertisement links below may advocate political positions that this site does not endorse.
Data for this Contest was Contributed by on 2007-02-01
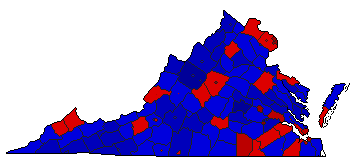
Map

AccomackByrne46.2%
 
Bolling53.4%
 
Other0.4%


AlbemarleByrne57.7%
 
Bolling42.2%
 
Other0.1%


AlleghanyByrne52.3%
 
Bolling47.7%
 
Other0.1%


AmeliaByrne34.7%
 
Bolling65.2%
 
Other0.1%


AmherstByrne41.6%
 
Bolling58.4%
 
Other0.1%


AppomattoxByrne36.5%
 
Bolling63.4%
 
Other0.0%


ArlingtonByrne72.9%
 
Bolling27.0%
 
Other0.2%


AugustaByrne29.0%
 
Bolling70.9%
 
Other0.0%


BathByrne46.9%
 
Bolling53.0%
 
Other0.1%


BedfordByrne34.2%
 
Bolling65.7%
 
Other0.1%


BlandByrne37.1%
 
Bolling62.9%


BotetourtByrne37.1%
 
Bolling62.6%
 
Other0.2%


BrunswickByrne60.0%
 
Bolling39.9%
 
Other0.1%


BuchananByrne56.2%
 
Bolling43.8%
 
Other0.0%


BuckinghamByrne47.0%
 
Bolling53.0%


CampbellByrne34.1%
 
Bolling65.8%
 
Other0.0%


CarolineByrne50.8%
 
Bolling49.2%
 
Other0.1%


CarrollByrne37.7%
 
Bolling62.2%
 
Other0.0%


Charles CityByrne65.3%
 
Bolling34.6%
 
Other0.1%


CharlotteByrne40.9%
 
Bolling59.1%


ChesterfieldByrne40.5%
 
Bolling59.4%
 
Other0.2%


ClarkeByrne46.0%
 
Bolling53.9%
 
Other0.1%


CraigByrne41.9%
 
Bolling58.0%
 
Other0.2%


CulpeperByrne36.9%
 
Bolling63.1%
 
Other0.0%


CumberlandByrne41.8%
 
Bolling58.2%


DickensonByrne52.4%
 
Bolling47.6%
 
Other0.1%


DinwiddieByrne44.9%
 
Bolling55.0%
 
Other0.1%


EssexByrne44.3%
 
Bolling55.7%
 
Other0.1%


FairfaxByrne59.3%
 
Bolling40.6%
 
Other0.1%


FauquierByrne41.8%
 
Bolling58.1%
 
Other0.1%


FloydByrne43.0%
 
Bolling56.8%
 
Other0.2%


FluvannaByrne47.5%
 
Bolling52.5%


FranklinByrne41.5%
 
Bolling58.5%
 
Other0.0%


FrederickByrne35.2%
 
Bolling64.7%
 
Other0.1%


GilesByrne47.7%
 
Bolling52.2%
 
Other0.1%


GloucesterByrne37.6%
 
Bolling62.2%
 
Other0.2%


GoochlandByrne38.5%
 
Bolling61.3%
 
Other0.1%


GraysonByrne39.6%
 
Bolling60.4%
 
Other0.0%


GreeneByrne39.5%
 
Bolling60.5%
 
Other0.0%


GreensvilleByrne56.0%
 
Bolling43.9%
 
Other0.1%


HalifaxByrne42.4%
 
Bolling57.6%
 
Other0.1%


HanoverByrne31.2%
 
Bolling68.7%
 
Other0.1%


HenricoByrne48.2%
 
Bolling51.6%
 
Other0.2%


HenryByrne46.8%
 
Bolling53.1%
 
Other0.0%


HighlandByrne38.5%
 
Bolling61.5%


Isle of WightByrne41.9%
 
Bolling57.7%
 
Other0.5%


James CityByrne44.3%
 
Bolling55.6%
 
Other0.1%


King and QueenByrne48.4%
 
Bolling51.5%
 
Other0.1%


King GeorgeByrne39.8%
 
Bolling60.0%
 
Other0.2%


King WilliamByrne38.6%
 
Bolling61.2%
 
Other0.2%


LancasterByrne40.8%
 
Bolling59.1%
 
Other0.1%


LeeByrne40.0%
 
Bolling60.0%
 
Other0.0%


LoudounByrne50.4%
 
Bolling49.4%
 
Other0.1%


LouisaByrne43.6%
 
Bolling56.3%
 
Other0.1%


LunenburgByrne44.9%
 
Bolling55.0%
 
Other0.1%


MadisonByrne42.2%
 
Bolling57.8%
 
Other0.1%


MathewsByrne39.6%
 
Bolling60.4%


MecklenburgByrne41.8%
 
Bolling58.2%


MiddlesexByrne37.8%
 
Bolling62.1%
 
Other0.1%


MontgomeryByrne52.8%
 
Bolling47.1%
 
Other0.1%


NelsonByrne53.6%
 
Bolling46.3%
 
Other0.1%


New KentByrne36.5%
 
Bolling63.4%
 
Other0.1%


NorthamptonByrne55.4%
 
Bolling44.2%
 
Other0.3%


NorthumberlandByrne42.3%
 
Bolling57.6%
 
Other0.1%


NottowayByrne46.8%
 
Bolling53.2%
 
Other0.0%


OrangeByrne42.3%
 
Bolling57.7%


PageByrne38.5%
 
Bolling61.3%
 
Other0.2%


PatrickByrne41.7%
 
Bolling58.3%
 
Other0.1%


PittsylvaniaByrne36.1%
 
Bolling63.8%
 
Other0.0%


PowhatanByrne29.1%
 
Bolling70.8%
 
Other0.1%


Prince EdwardByrne50.0%
 
Bolling50.0%
 
Other0.0%


Prince GeorgeByrne38.8%
 
Bolling61.0%
 
Other0.2%


Prince WilliamByrne48.9%
 
Bolling51.0%
 
Other0.1%


PulaskiByrne44.3%
 
Bolling55.7%


RappahannockByrne50.9%
 
Bolling48.7%
 
Other0.4%


RichmondByrne37.2%
 
Bolling62.8%


RoanokeByrne39.9%
 
Bolling59.9%
 
Other0.1%


RockbridgeByrne43.8%
 
Bolling56.2%
 
Other0.1%


RockinghamByrne30.0%
 
Bolling69.8%
 
Other0.2%


RussellByrne47.1%
 
Bolling52.9%


ScottByrne30.5%
 
Bolling69.5%
 
Other0.1%


ShenandoahByrne32.5%
 
Bolling67.3%
 
Other0.2%


SmythByrne35.5%
 
Bolling64.4%
 
Other0.1%


SouthamptonByrne47.2%
 
Bolling52.6%
 
Other0.2%


SpotsylvaniaByrne40.8%
 
Bolling59.0%
 
Other0.2%


StaffordByrne41.6%
 
Bolling58.3%
 
Other0.1%


SurryByrne57.6%
 
Bolling42.3%
 
Other0.1%


SussexByrne53.4%
 
Bolling46.6%


TazewellByrne41.5%
 
Bolling58.5%


WarrenByrne41.0%
 
Bolling58.9%
 
Other0.1%


WashingtonByrne33.0%
 
Bolling66.9%
 
Other0.1%


WestmorelandByrne50.4%
 
Bolling49.5%
 
Other0.0%


WiseByrne41.2%
 
Bolling58.8%
 
Other0.0%


WytheByrne36.4%
 
Bolling63.5%
 
Other0.1%


YorkByrne40.6%
 
Bolling59.2%
 
Other0.1%


City

AlexandriaByrne71.0%
 
Bolling28.8%
 
Other0.2%


BedfordByrne45.4%
 
Bolling54.5%
 
Other0.1%


BristolByrne35.2%
 
Bolling64.7%
 
Other0.1%


Buena VistaByrne49.4%
 
Bolling50.5%
 
Other0.1%


CharlottesvilleByrne78.3%
 
Bolling21.5%
 
Other0.2%


ChesapeakeByrne47.4%
 
Bolling52.1%
 
Other0.4%


Colonial HeightsByrne26.2%
 
Bolling73.7%
 
Other0.1%


CovingtonByrne60.9%
 
Bolling39.0%
 
Other0.1%


DanvilleByrne51.3%
 
Bolling48.6%
 
Other0.1%


EmporiaByrne48.4%
 
Bolling51.4%
 
Other0.3%


FairfaxByrne56.0%
 
Bolling43.7%
 
Other0.3%


Falls ChurchByrne72.1%
 
Bolling27.5%
 
Other0.4%


FranklinByrne53.0%
 
Bolling46.6%
 
Other0.4%


FredericksburgByrne58.2%
 
Bolling41.4%
 
Other0.4%


GalaxByrne49.1%
 
Bolling50.8%
 
Other0.1%


HamptonByrne61.6%
 
Bolling38.2%
 
Other0.2%


HarrisonburgByrne48.4%
 
Bolling51.3%
 
Other0.3%


HopewellByrne42.5%
 
Bolling57.5%
 
Other0.1%


LexingtonByrne61.5%
 
Bolling38.3%
 
Other0.2%


LynchburgByrne47.0%
 
Bolling52.8%
 
Other0.2%


ManassasByrne45.0%
 
Bolling54.9%
 
Other0.1%


Manassas ParkByrne45.8%
 
Bolling54.1%
 
Other0.1%


MartinsvilleByrne58.7%
 
Bolling41.2%
 
Other0.1%


Newport NewsByrne54.6%
 
Bolling45.1%
 
Other0.2%


NorfolkByrne62.3%
 
Bolling36.7%
 
Other1.1%


NortonByrne48.1%
 
Bolling51.9%


PetersburgByrne80.2%
 
Bolling19.7%
 
Other0.0%


PoquosonByrne30.1%
 
Bolling69.7%
 
Other0.2%


PortsmouthByrne63.1%
 
Bolling36.2%
 
Other0.6%


RadfordByrne50.5%
 
Bolling49.5%
 
Other0.0%


RichmondByrne70.9%
 
Bolling28.8%
 
Other0.3%


RoanokeByrne58.7%
 
Bolling41.1%
 
Other0.2%


SalemByrne41.2%
 
Bolling58.6%
 
Other0.1%


StauntonByrne41.9%
 
Bolling58.1%
 
Other0.1%


SuffolkByrne50.1%
 
Bolling49.5%
 
Other0.4%


Virginia BeachByrne43.7%
 
Bolling55.4%
 
Other0.9%


WaynesboroByrne40.5%
 
Bolling59.4%
 
Other0.1%


WilliamsburgByrne55.7%
 
Bolling44.0%
 
Other0.3%


WinchesterByrne48.1%
 
Bolling51.6%
 
Other0.3%


National DataGraph for 2005 - Virginia Results for 2005

Login

Terms of Use - DCMA Policy - Privacy Policy and Cookies


© Dave Leip's Atlas of U.S. Elections, LLC 2019 All Rights Reserved