2006 Senatorial General Election Data Graphs - Maryland
by County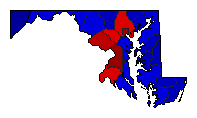
| Allegany | Cardin | 38.9% | |
| Steele | 59.7% | |
| 0.0% | |
| Other | 1.4% | |
| Anne Arundel | Cardin | 44.2% | |
| Steele | 54.0% | |
| 0.0% | |
| Other | 1.8% | |
| Baltimore | Cardin | 51.5% | |
| Steele | 46.6% | |
| 0.0% | |
| Other | 1.9% | |
| Calvert | Cardin | 42.5% | |
| Steele | 55.9% | |
| 0.0% | |
| Other | 1.6% | |
| Caroline | Cardin | 31.7% | |
| Steele | 66.1% | |
| 0.0% | |
| Other | 2.1% | |
| Carroll | Cardin | 30.2% | |
| Steele | 68.0% | |
| 0.0% | |
| Other | 1.8% | |
| Cecil | Cardin | 40.7% | |
| Steele | 57.2% | |
| 0.0% | |
| Other | 2.1% | |
| Charles | Cardin | 50.8% | |
| Steele | 47.9% | |
| 0.0% | |
| Other | 1.4% | |
| Dorchester | Cardin | 39.3% | |
| Steele | 59.4% | |
| 0.0% | |
| Other | 1.3% | |
| Frederick | Cardin | 40.4% | |
| Steele | 57.9% | |
| 0.0% | |
| Other | 1.7% | |
| Garrett | Cardin | 27.4% | |
| Steele | 71.4% | |
| 0.0% | |
| Other | 1.2% | |
| Harford | Cardin | 35.8% | |
| Steele | 62.3% | |
| 0.0% | |
| Other | 1.9% | |
| Howard | Cardin | 53.9% | |
| Steele | 44.6% | |
| 0.0% | |
| Other | 1.6% | |
| Kent | Cardin | 44.3% | |
| Steele | 53.9% | |
| 0.0% | |
| Other | 1.7% | |
| Montgomery | Cardin | 67.2% | |
| Steele | 31.6% | |
| 0.0% | |
| Other | 1.2% | |
| Prince George's | Cardin | 75.0% | |
| Steele | 24.0% | |
| 0.0% | |
| Other | 1.0% | |
| Queen Anne's | Cardin | 33.0% | |
| Steele | 65.2% | |
| 0.0% | |
| Other | 1.8% | |
| St. Mary's | Cardin | 40.8% | |
| Steele | 57.5% | |
| 0.0% | |
| Other | 1.7% | |
| Somerset | Cardin | 39.5% | |
| Steele | 58.9% | |
| 0.0% | |
| Other | 1.5% | |
| Talbot | Cardin | 37.1% | |
| Steele | 61.5% | |
| 0.0% | |
| Other | 1.3% | |
| Washington | Cardin | 38.6% | |
| Steele | 60.0% | |
| 0.0% | |
| Other | 1.5% | |
| Wicomico | Cardin | 37.7% | |
| Steele | 60.8% | |
| 0.0% | |
| Other | 1.5% | |
| Worcester | Cardin | 37.5% | |
| Steele | 61.3% | |
| 0.0% | |
| Other | 1.3% | |
City| Baltimore | Cardin | 74.5% | |
| Steele | 23.2% | |
| 0.0% | |
| Other | 2.2% | |