2006 Secretary of State General Election Data Graphs - Massachusetts
by CountyData for this Contest was Contributed by on 2016-09-27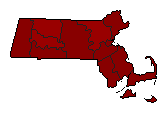
| Barnstable | Galvin | 80.9% | |
| 0.0% | |
| Other | 19.1% | |
| Berkshire | Galvin | 84.1% | |
| 0.0% | |
| Other | 15.9% | |
| Bristol | Galvin | 83.8% | |
| 0.0% | |
| Other | 16.2% | |
| Dukes | Galvin | 81.2% | |
| 0.0% | |
| Other | 18.8% | |
| Essex | Galvin | 82.7% | |
| 0.0% | |
| Other | 17.3% | |
| Franklin | Galvin | 76.2% | |
| 0.0% | |
| Other | 23.8% | |
| Hampden | Galvin | 83.3% | |
| 0.0% | |
| Other | 16.7% | |
| Hampshire | Galvin | 74.8% | |
| 0.0% | |
| Other | 25.2% | |
| Middlesex | Galvin | 79.7% | |
| 0.0% | |
| Other | 20.3% | |
| Nantucket | Galvin | 83.0% | |
| 0.0% | |
| Other | 17.0% | |
| Norfolk | Galvin | 83.7% | |
| 0.0% | |
| Other | 16.3% | |
| Plymouth | Galvin | 83.8% | |
| 0.0% | |
| Other | 16.2% | |
| Suffolk | Galvin | 84.5% | |
| 0.0% | |
| Other | 15.5% | |
| Worcester | Galvin | 82.1% | |
| 0.0% | |
| Other | 17.9% | |