2006 Gubernatorial General Election Data Graphs - Michigan
Note: The Google advertisement links below may advocate political positions that this site does not endorse.
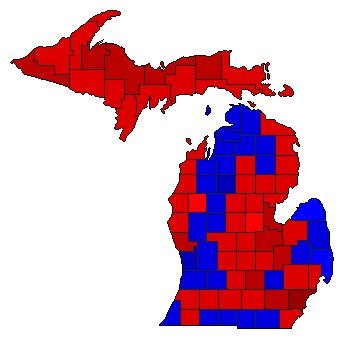
Map

AlconaGranholm51.1%
 
DeVos47.3%
 
0.0%
 
Other1.6%


AlgerGranholm60.7%
 
DeVos37.8%
 
0.0%
 
Other1.6%


AlleganGranholm43.8%
 
DeVos55.0%
 
0.0%
 
Other1.2%


AlpenaGranholm59.7%
 
DeVos39.0%
 
0.0%
 
Other1.3%


AntrimGranholm44.8%
 
DeVos53.7%
 
0.0%
 
Other1.5%


ArenacGranholm56.2%
 
DeVos42.2%
 
0.0%
 
Other1.5%


BaragaGranholm60.4%
 
DeVos37.8%
 
0.0%
 
Other1.8%


BarryGranholm47.8%
 
DeVos50.7%
 
0.0%
 
Other1.6%


BayGranholm60.9%
 
DeVos37.7%
 
0.0%
 
Other1.5%


BenzieGranholm52.8%
 
DeVos45.6%
 
0.0%
 
Other1.6%


BerrienGranholm46.5%
 
DeVos52.2%
 
0.0%
 
Other1.3%


BranchGranholm48.0%
 
DeVos50.4%
 
0.0%
 
Other1.6%


CalhounGranholm56.6%
 
DeVos41.9%
 
0.0%
 
Other1.5%


CassGranholm50.3%
 
DeVos48.4%
 
0.0%
 
Other1.4%


CharlevoixGranholm47.1%
 
DeVos50.5%
 
0.0%
 
Other2.4%


CheboyganGranholm47.2%
 
DeVos51.0%
 
0.0%
 
Other1.8%


ChippewaGranholm56.5%
 
DeVos42.1%
 
0.0%
 
Other1.4%


ClareGranholm51.7%
 
DeVos46.5%
 
0.0%
 
Other1.9%


ClintonGranholm54.2%
 
DeVos44.7%
 
0.0%
 
Other1.2%


CrawfordGranholm50.5%
 
DeVos47.6%
 
0.0%
 
Other1.8%


DeltaGranholm58.8%
 
DeVos40.0%
 
0.0%
 
Other1.2%


DickinsonGranholm53.8%
 
DeVos44.8%
 
0.0%
 
Other1.5%


EatonGranholm57.6%
 
DeVos41.1%
 
0.0%
 
Other1.2%


EmmetGranholm45.5%
 
DeVos52.9%
 
0.0%
 
Other1.6%


GeneseeGranholm65.8%
 
DeVos33.0%
 
0.0%
 
Other1.2%


GladwinGranholm51.9%
 
DeVos46.1%
 
0.0%
 
Other2.0%


GogebicGranholm62.0%
 
DeVos36.0%
 
0.0%
 
Other2.0%


Grand TraverseGranholm47.5%
 
DeVos51.0%
 
0.0%
 
Other1.5%


GratiotGranholm54.4%
 
DeVos44.4%
 
0.0%
 
Other1.2%


HillsdaleGranholm40.8%
 
DeVos57.4%
 
0.0%
 
Other1.8%


HoughtonGranholm54.3%
 
DeVos44.1%
 
0.0%
 
Other1.7%


HuronGranholm49.2%
 
DeVos49.5%
 
0.0%
 
Other1.3%


InghamGranholm66.4%
 
DeVos32.4%
 
0.0%
 
Other1.2%


IoniaGranholm52.1%
 
DeVos46.6%
 
0.0%
 
Other1.3%


IoscoGranholm53.9%
 
DeVos44.6%
 
0.0%
 
Other1.5%


IronGranholm58.8%
 
DeVos39.6%
 
0.0%
 
Other1.7%


IsabellaGranholm56.5%
 
DeVos41.9%
 
0.0%
 
Other1.6%


JacksonGranholm50.1%
 
DeVos48.5%
 
0.0%
 
Other1.5%


KalamazooGranholm59.5%
 
DeVos39.2%
 
0.0%
 
Other1.3%


KalkaskaGranholm44.0%
 
DeVos54.1%
 
0.0%
 
Other1.9%


KentGranholm45.7%
 
DeVos53.4%
 
0.0%
 
Other1.0%


KeweenawGranholm54.4%
 
DeVos43.7%
 
0.0%
 
Other1.9%


LakeGranholm49.3%
 
DeVos48.7%
 
0.0%
 
Other2.0%


LapeerGranholm45.8%
 
DeVos52.3%
 
0.0%
 
Other1.9%


LeelanauGranholm51.4%
 
DeVos47.2%
 
0.0%
 
Other1.3%


LenaweeGranholm47.1%
 
DeVos51.1%
 
0.0%
 
Other1.8%


LivingstonGranholm41.6%
 
DeVos57.1%
 
0.0%
 
Other1.4%


LuceGranholm64.7%
 
DeVos34.1%
 
0.0%
 
Other1.2%


MackinacGranholm52.5%
 
DeVos46.3%
 
0.0%
 
Other1.2%


MacombGranholm52.2%
 
DeVos46.3%
 
0.0%
 
Other1.6%


ManisteeGranholm54.4%
 
DeVos44.1%
 
0.0%
 
Other1.5%


MarquetteGranholm67.0%
 
DeVos31.9%
 
0.0%
 
Other1.2%


MasonGranholm50.5%
 
DeVos48.4%
 
0.0%
 
Other1.2%


MecostaGranholm47.7%
 
DeVos51.1%
 
0.0%
 
Other1.3%


MenomineeGranholm53.7%
 
DeVos44.3%
 
0.0%
 
Other2.0%


MidlandGranholm49.5%
 
DeVos48.9%
 
0.0%
 
Other1.5%


MissaukeeGranholm35.6%
 
DeVos62.9%
 
0.0%
 
Other1.4%


MonroeGranholm53.9%
 
DeVos44.6%
 
0.0%
 
Other1.5%


MontcalmGranholm53.3%
 
DeVos45.4%
 
0.0%
 
Other1.3%


MontmorencyGranholm46.2%
 
DeVos51.9%
 
0.0%
 
Other1.9%


MuskegonGranholm63.5%
 
DeVos35.5%
 
0.0%
 
Other1.0%


NewaygoGranholm47.0%
 
DeVos51.8%
 
0.0%
 
Other1.2%


OaklandGranholm54.0%
 
DeVos44.6%
 
0.0%
 
Other1.3%


OceanaGranholm52.2%
 
DeVos46.6%
 
0.0%
 
Other1.2%


OgemawGranholm51.8%
 
DeVos46.6%
 
0.0%
 
Other1.6%


OntonagonGranholm56.6%
 
DeVos41.9%
 
0.0%
 
Other1.5%


OsceolaGranholm41.7%
 
DeVos56.7%
 
0.0%
 
Other1.6%


OscodaGranholm46.1%
 
DeVos52.1%
 
0.0%
 
Other1.8%


OtsegoGranholm43.4%
 
DeVos54.9%
 
0.0%
 
Other1.6%


OttawaGranholm33.9%
 
DeVos65.1%
 
0.0%
 
Other1.0%


Presque IsleGranholm55.1%
 
DeVos43.5%
 
0.0%
 
Other1.4%


RoscommonGranholm52.7%
 
DeVos45.4%
 
0.0%
 
Other1.9%


SaginawGranholm61.0%
 
DeVos37.8%
 
0.0%
 
Other1.2%


St. ClairGranholm48.5%
 
DeVos49.8%
 
0.0%
 
Other1.7%


St. JosephGranholm46.2%
 
DeVos52.3%
 
0.0%
 
Other1.5%


SanilacGranholm42.0%
 
DeVos56.5%
 
0.0%
 
Other1.5%


SchoolcraftGranholm57.6%
 
DeVos40.7%
 
0.0%
 
Other1.7%


ShiawasseeGranholm56.6%
 
DeVos41.9%
 
0.0%
 
Other1.5%


TuscolaGranholm51.5%
 
DeVos46.9%
 
0.0%
 
Other1.6%


Van BurenGranholm55.3%
 
DeVos43.2%
 
0.0%
 
Other1.5%


WashtenawGranholm68.0%
 
DeVos30.6%
 
0.0%
 
Other1.4%


WayneGranholm71.6%
 
DeVos27.3%
 
0.0%
 
Other1.1%


WexfordGranholm45.6%
 
DeVos52.8%
 
0.0%
 
Other1.6%


National DataGraph for 2006 - Michigan Results for 2006

Login

Terms of Use - DCMA Policy - Privacy Policy and Cookies


© Dave Leip's Atlas of U.S. Elections, LLC 2019 All Rights Reserved