2006 Senatorial General Election Data Graphs - Mississippi
by County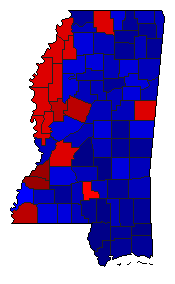
| Adams | Fleming | 49.2% | |
| Lott | 49.8% | |
| 0.0% | |
| Other | 1.0% | |
| Alcorn | Fleming | 30.9% | |
| Lott | 67.0% | |
| 0.0% | |
| Other | 2.1% | |
| Amite | Fleming | 38.6% | |
| Lott | 59.5% | |
| 0.0% | |
| Other | 1.9% | |
| Attala | Fleming | 37.0% | |
| Lott | 62.1% | |
| 0.0% | |
| Other | 0.9% | |
| Benton | Fleming | 46.0% | |
| Lott | 52.0% | |
| 0.0% | |
| Other | 2.1% | |
| Bolivar | Fleming | 54.9% | |
| Lott | 43.8% | |
| 0.0% | |
| Other | 1.3% | |
| Calhoun | Fleming | 31.0% | |
| Lott | 67.9% | |
| 0.0% | |
| Other | 1.1% | |
| Carroll | Fleming | 29.4% | |
| Lott | 69.5% | |
| 0.0% | |
| Other | 1.1% | |
| Chickasaw | Fleming | 45.7% | |
| Lott | 53.0% | |
| 0.0% | |
| Other | 1.4% | |
| Choctaw | Fleming | 30.9% | |
| Lott | 67.4% | |
| 0.0% | |
| Other | 1.7% | |
| Claiborne | Fleming | 73.0% | |
| Lott | 25.8% | |
| 0.0% | |
| Other | 1.2% | |
| Clarke | Fleming | 31.5% | |
| Lott | 66.8% | |
| 0.0% | |
| Other | 1.7% | |
| Clay | Fleming | 47.3% | |
| Lott | 50.9% | |
| 0.0% | |
| Other | 1.8% | |
| Coahoma | Fleming | 51.1% | |
| Lott | 46.9% | |
| 0.0% | |
| Other | 2.0% | |
| Copiah | Fleming | 41.2% | |
| Lott | 57.4% | |
| 0.0% | |
| Other | 1.3% | |
| Covington | Fleming | 31.1% | |
| Lott | 67.1% | |
| 0.0% | |
| Other | 1.8% | |
| DeSoto | Fleming | 23.5% | |
| Lott | 74.6% | |
| 0.0% | |
| Other | 1.9% | |
| Forrest | Fleming | 28.7% | |
| Lott | 69.5% | |
| 0.0% | |
| Other | 1.8% | |
| Franklin | Fleming | 30.1% | |
| Lott | 68.7% | |
| 0.0% | |
| Other | 1.2% | |
| George | Fleming | 14.6% | |
| Lott | 83.7% | |
| 0.0% | |
| Other | 1.7% | |
| Greene | Fleming | 18.8% | |
| Lott | 79.0% | |
| 0.0% | |
| Other | 2.2% | |
| Grenada | Fleming | 33.7% | |
| Lott | 65.0% | |
| 0.0% | |
| Other | 1.3% | |
| Hancock | Fleming | 17.4% | |
| Lott | 80.5% | |
| 0.0% | |
| Other | 2.1% | |
| Harrison | Fleming | 22.3% | |
| Lott | 76.1% | |
| 0.0% | |
| Other | 1.7% | |
| Hinds | Fleming | 56.8% | |
| Lott | 41.7% | |
| 0.0% | |
| Other | 1.5% | |
| Holmes | Fleming | 69.2% | |
| Lott | 28.5% | |
| 0.0% | |
| Other | 2.3% | |
| Humphreys | Fleming | 60.3% | |
| Lott | 38.0% | |
| 0.0% | |
| Other | 1.7% | |
| Issaquena | Fleming | 54.3% | |
| Lott | 44.7% | |
| 0.0% | |
| Other | 1.0% | |
| Itawamba | Fleming | 26.7% | |
| Lott | 71.7% | |
| 0.0% | |
| Other | 1.6% | |
| Jackson | Fleming | 18.8% | |
| Lott | 79.7% | |
| 0.0% | |
| Other | 1.5% | |
| Jasper | Fleming | 47.0% | |
| Lott | 51.6% | |
| 0.0% | |
| Other | 1.4% | |
| Jefferson | Fleming | 74.5% | |
| Lott | 24.0% | |
| 0.0% | |
| Other | 1.5% | |
| Jefferson Davis | Fleming | 49.8% | |
| Lott | 48.8% | |
| 0.0% | |
| Other | 1.5% | |
| Jones | Fleming | 23.2% | |
| Lott | 75.3% | |
| 0.0% | |
| Other | 1.5% | |
| Kemper | Fleming | 43.9% | |
| Lott | 53.5% | |
| 0.0% | |
| Other | 2.6% | |
| Lafayette | Fleming | 37.0% | |
| Lott | 60.8% | |
| 0.0% | |
| Other | 2.2% | |
| Lamar | Fleming | 13.9% | |
| Lott | 84.7% | |
| 0.0% | |
| Other | 1.5% | |
| Lauderdale | Fleming | 25.1% | |
| Lott | 73.4% | |
| 0.0% | |
| Other | 1.4% | |
| Lawrence | Fleming | 32.6% | |
| Lott | 66.0% | |
| 0.0% | |
| Other | 1.4% | |
| Leake | Fleming | 39.6% | |
| Lott | 59.3% | |
| 0.0% | |
| Other | 1.1% | |
| Lee | Fleming | 29.3% | |
| Lott | 68.9% | |
| 0.0% | |
| Other | 1.7% | |
| Leflore | Fleming | 47.8% | |
| Lott | 51.3% | |
| 0.0% | |
| Other | 0.9% | |
| Lincoln | Fleming | 27.9% | |
| Lott | 71.0% | |
| 0.0% | |
| Other | 1.0% | |
| Lowndes | Fleming | 32.7% | |
| Lott | 66.2% | |
| 0.0% | |
| Other | 1.1% | |
| Madison | Fleming | 33.3% | |
| Lott | 65.5% | |
| 0.0% | |
| Other | 1.2% | |
| Marion | Fleming | 27.1% | |
| Lott | 71.2% | |
| 0.0% | |
| Other | 1.7% | |
| Marshall | Fleming | 52.8% | |
| Lott | 44.6% | |
| 0.0% | |
| Other | 2.6% | |
| Monroe | Fleming | 35.7% | |
| Lott | 63.2% | |
| 0.0% | |
| Other | 1.1% | |
| Montgomery | Fleming | 37.5% | |
| Lott | 61.4% | |
| 0.0% | |
| Other | 1.1% | |
| Neshoba | Fleming | 20.2% | |
| Lott | 78.6% | |
| 0.0% | |
| Other | 1.3% | |
| Newton | Fleming | 22.3% | |
| Lott | 76.6% | |
| 0.0% | |
| Other | 1.0% | |
| Noxubee | Fleming | 57.0% | |
| Lott | 40.6% | |
| 0.0% | |
| Other | 2.4% | |
| Oktibbeha | Fleming | 43.2% | |
| Lott | 55.3% | |
| 0.0% | |
| Other | 1.4% | |
| Panola | Fleming | 42.7% | |
| Lott | 56.0% | |
| 0.0% | |
| Other | 1.3% | |
| Pearl River | Fleming | 17.9% | |
| Lott | 80.1% | |
| 0.0% | |
| Other | 2.0% | |
| Perry | Fleming | 19.2% | |
| Lott | 78.6% | |
| 0.0% | |
| Other | 2.1% | |
| Pike | Fleming | 40.2% | |
| Lott | 58.4% | |
| 0.0% | |
| Other | 1.4% | |
| Pontotoc | Fleming | 20.6% | |
| Lott | 78.1% | |
| 0.0% | |
| Other | 1.3% | |
| Prentiss | Fleming | 28.2% | |
| Lott | 70.0% | |
| 0.0% | |
| Other | 1.8% | |
| Quitman | Fleming | 57.5% | |
| Lott | 40.6% | |
| 0.0% | |
| Other | 1.9% | |
| Rankin | Fleming | 17.7% | |
| Lott | 80.7% | |
| 0.0% | |
| Other | 1.7% | |
| Scott | Fleming | 33.5% | |
| Lott | 65.6% | |
| 0.0% | |
| Other | 0.9% | |
| Sharkey | Fleming | 55.3% | |
| Lott | 43.5% | |
| 0.0% | |
| Other | 1.2% | |
| Simpson | Fleming | 29.3% | |
| Lott | 69.4% | |
| 0.0% | |
| Other | 1.3% | |
| Smith | Fleming | 18.1% | |
| Lott | 80.5% | |
| 0.0% | |
| Other | 1.4% | |
| Stone | Fleming | 20.8% | |
| Lott | 77.4% | |
| 0.0% | |
| Other | 1.8% | |
| Sunflower | Fleming | 54.4% | |
| Lott | 44.5% | |
| 0.0% | |
| Other | 1.2% | |
| Tallahatchie | Fleming | 44.9% | |
| Lott | 53.0% | |
| 0.0% | |
| Other | 2.1% | |
| Tate | Fleming | 33.9% | |
| Lott | 64.2% | |
| 0.0% | |
| Other | 2.0% | |
| Tippah | Fleming | 25.2% | |
| Lott | 72.9% | |
| 0.0% | |
| Other | 1.9% | |
| Tishomingo | Fleming | 36.9% | |
| Lott | 60.9% | |
| 0.0% | |
| Other | 2.1% | |
| Tunica | Fleming | 58.9% | |
| Lott | 37.5% | |
| 0.0% | |
| Other | 3.6% | |
| Union | Fleming | 25.0% | |
| Lott | 73.5% | |
| 0.0% | |
| Other | 1.5% | |
| Walthall | Fleming | 32.8% | |
| Lott | 65.3% | |
| 0.0% | |
| Other | 1.9% | |
| Warren | Fleming | 36.2% | |
| Lott | 62.7% | |
| 0.0% | |
| Other | 1.1% | |
| Washington | Fleming | 53.5% | |
| Lott | 45.1% | |
| 0.0% | |
| Other | 1.4% | |
| Wayne | Fleming | 30.0% | |
| Lott | 68.7% | |
| 0.0% | |
| Other | 1.2% | |
| Webster | Fleming | 20.2% | |
| Lott | 78.5% | |
| 0.0% | |
| Other | 1.4% | |
| Wilkinson | Fleming | 61.0% | |
| Lott | 37.1% | |
| 0.0% | |
| Other | 2.0% | |
| Winston | Fleming | 35.6% | |
| Lott | 62.8% | |
| 0.0% | |
| Other | 1.5% | |
| Yalobusha | Fleming | 40.4% | |
| Lott | 58.2% | |
| 0.0% | |
| Other | 1.4% | |
| Yazoo | Fleming | 40.2% | |
| Lott | 58.6% | |
| 0.0% | |
| Other | 1.1% | |