2006 Gubernatorial Republican Primary Election Data Graphs - Ohio
Note: The Google advertisement links below may advocate political positions that this site does not endorse.
Data for this Contest was Contributed by on 2007-03-26
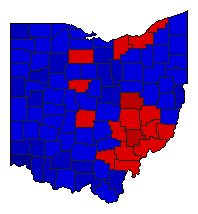
Map

AdamsPetro46.7%
 
Blackwell53.3%


AllenPetro39.8%
 
Blackwell60.2%


AshlandPetro38.4%
 
Blackwell61.6%


AshtabulaPetro48.7%
 
Blackwell51.3%


AthensPetro54.6%
 
Blackwell45.4%


AuglaizePetro43.1%
 
Blackwell56.9%


BelmontPetro40.8%
 
Blackwell59.2%


BrownPetro35.5%
 
Blackwell64.5%


ButlerPetro34.0%
 
Blackwell66.0%


CarrollPetro45.6%
 
Blackwell54.4%


ChampaignPetro43.0%
 
Blackwell57.0%


ClarkPetro49.8%
 
Blackwell50.2%


ClermontPetro31.6%
 
Blackwell68.4%


ClintonPetro43.3%
 
Blackwell56.7%


ColumbianaPetro43.4%
 
Blackwell56.6%


CoshoctonPetro64.2%
 
Blackwell35.8%


CrawfordPetro43.7%
 
Blackwell56.3%


CuyahogaPetro57.1%
 
Blackwell42.9%


DarkePetro44.3%
 
Blackwell55.7%


DefiancePetro43.0%
 
Blackwell57.0%


DelawarePetro47.5%
 
Blackwell52.5%


EriePetro46.6%
 
Blackwell53.4%


FairfieldPetro48.9%
 
Blackwell51.1%


FayettePetro47.9%
 
Blackwell52.1%


FranklinPetro52.3%
 
Blackwell47.7%


FultonPetro42.3%
 
Blackwell57.7%


GalliaPetro35.6%
 
Blackwell64.4%


GeaugaPetro48.7%
 
Blackwell51.3%


GreenePetro41.7%
 
Blackwell58.3%


GuernseyPetro54.7%
 
Blackwell45.3%


HamiltonPetro25.2%
 
Blackwell74.8%


HancockPetro38.5%
 
Blackwell61.5%


HardinPetro48.7%
 
Blackwell51.3%


HarrisonPetro44.7%
 
Blackwell55.3%


HenryPetro43.9%
 
Blackwell56.1%


HighlandPetro35.1%
 
Blackwell64.9%


HockingPetro46.4%
 
Blackwell53.6%


HolmesPetro49.6%
 
Blackwell50.4%


HuronPetro39.5%
 
Blackwell60.5%


JacksonPetro42.3%
 
Blackwell57.7%


JeffersonPetro34.1%
 
Blackwell65.9%


KnoxPetro37.8%
 
Blackwell62.2%


LakePetro51.8%
 
Blackwell48.2%


LawrencePetro43.2%
 
Blackwell56.8%


LickingPetro45.6%
 
Blackwell54.4%


LoganPetro47.6%
 
Blackwell52.4%


LorainPetro51.0%
 
Blackwell49.0%


LucasPetro44.2%
 
Blackwell55.8%


MadisonPetro48.9%
 
Blackwell51.1%


MahoningPetro47.9%
 
Blackwell52.1%


MarionPetro50.3%
 
Blackwell49.7%


MedinaPetro46.2%
 
Blackwell53.8%


MeigsPetro54.8%
 
Blackwell45.2%


MercerPetro32.2%
 
Blackwell67.8%


MiamiPetro40.6%
 
Blackwell59.4%


MonroePetro57.3%
 
Blackwell42.7%


MontgomeryPetro41.5%
 
Blackwell58.5%


MorganPetro61.5%
 
Blackwell38.5%


MorrowPetro44.3%
 
Blackwell55.7%


MuskingumPetro51.6%
 
Blackwell48.4%


NoblePetro59.7%
 
Blackwell40.3%


OttawaPetro47.0%
 
Blackwell53.0%


PauldingPetro41.1%
 
Blackwell58.9%


PerryPetro50.8%
 
Blackwell49.2%


PickawayPetro45.7%
 
Blackwell54.3%


PikePetro39.8%
 
Blackwell60.2%


PortagePetro47.1%
 
Blackwell52.9%


PreblePetro47.3%
 
Blackwell52.7%


PutnamPetro40.5%
 
Blackwell59.5%


RichlandPetro40.0%
 
Blackwell60.0%


RossPetro47.2%
 
Blackwell52.8%


SanduskyPetro46.9%
 
Blackwell53.1%


SciotoPetro38.6%
 
Blackwell61.4%


SenecaPetro51.9%
 
Blackwell48.1%


ShelbyPetro35.7%
 
Blackwell64.3%


StarkPetro49.9%
 
Blackwell50.1%


SummitPetro46.5%
 
Blackwell53.5%


TrumbullPetro43.8%
 
Blackwell56.3%


TuscarawasPetro41.7%
 
Blackwell58.3%


UnionPetro46.4%
 
Blackwell53.6%


Van WertPetro47.2%
 
Blackwell52.8%


VintonPetro54.2%
 
Blackwell45.8%


WarrenPetro30.4%
 
Blackwell69.6%


WashingtonPetro52.9%
 
Blackwell47.1%


WaynePetro42.0%
 
Blackwell58.0%


WilliamsPetro39.2%
 
Blackwell60.8%


WoodPetro45.0%
 
Blackwell55.0%


WyandotPetro44.9%
 
Blackwell55.1%


National DataGraph for 2006 - Ohio Results for 2006

Login

Terms of Use - DCMA Policy - Privacy Policy and Cookies


© Dave Leip's Atlas of U.S. Elections, LLC 2019 All Rights Reserved