2006 Senatorial General Election Data Graphs - Arizona
by County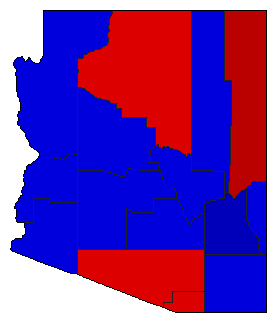
| Apache | Pederson | 60.8% | |
| Kyl | 34.8% | |
| 0.0% | |
| Other | 4.4% | |
| Cochise | Pederson | 40.9% | |
| Kyl | 55.6% | |
| 0.0% | |
| Other | 3.6% | |
| Coconino | Pederson | 54.1% | |
| Kyl | 42.0% | |
| 0.0% | |
| Other | 3.8% | |
| Gila | Pederson | 39.8% | |
| Kyl | 57.0% | |
| 0.0% | |
| Other | 3.2% | |
| Graham | Pederson | 28.0% | |
| Kyl | 65.4% | |
| 0.0% | |
| Other | 6.6% | |
| Greenlee | Pederson | 44.2% | |
| Kyl | 50.2% | |
| 0.0% | |
| Other | 5.6% | |
| La Paz | Pederson | 38.0% | |
| Kyl | 57.5% | |
| 0.0% | |
| Other | 4.5% | |
| Maricopa | Pederson | 41.3% | |
| Kyl | 55.7% | |
| 0.0% | |
| Other | 3.0% | |
| Mohave | Pederson | 37.0% | |
| Kyl | 58.7% | |
| 0.0% | |
| Other | 4.3% | |
| Navajo | Pederson | 44.2% | |
| Kyl | 52.2% | |
| 0.0% | |
| Other | 3.6% | |
| Pima | Pederson | 51.3% | |
| Kyl | 45.9% | |
| 0.0% | |
| Other | 2.8% | |
| Pinal | Pederson | 43.5% | |
| Kyl | 53.3% | |
| 0.0% | |
| Other | 3.2% | |
| Santa Cruz | Pederson | 60.0% | |
| Kyl | 37.6% | |
| 0.0% | |
| Other | 2.4% | |
| Yavapai | Pederson | 36.4% | |
| Kyl | 59.7% | |
| 0.0% | |
| Other | 3.9% | |
| Yuma | Pederson | 43.0% | |
| Kyl | 54.1% | |
| 0.0% | |
| Other | 2.9% | |