2006 Attorney General General Election Data Graphs - Vermont
by CountyData for this Contest was Contributed by on 2007-03-06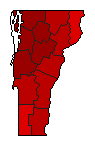
| Addison | Sorrell | 72.7% | |
| Carver | 24.7% | |
| Other | 2.6% | |
| Bennington | Sorrell | 59.9% | |
| Carver | 30.2% | |
| Other | 9.9% | |
| Caledonia | Sorrell | 60.6% | |
| Carver | 36.1% | |
| Other | 3.3% | |
| Chittenden | Sorrell | 76.9% | |
| Carver | 20.8% | |
| Other | 2.3% | |
| Essex | Sorrell | 57.0% | |
| Carver | 38.4% | |
| Other | 4.6% | |
| Franklin | Sorrell | 71.2% | |
| Carver | 26.2% | |
| Other | 2.7% | |
| Grand Isle | Sorrell | 72.6% | |
| Carver | 24.6% | |
| Other | 2.8% | |
| Lamoille | Sorrell | 70.6% | |
| Carver | 26.0% | |
| Other | 3.4% | |
| Orange | Sorrell | 63.7% | |
| Carver | 32.8% | |
| Other | 3.5% | |
| Orleans | Sorrell | 66.1% | |
| Carver | 29.9% | |
| Other | 4.0% | |
| Rutland | Sorrell | 61.2% | |
| Carver | 34.2% | |
| Other | 4.6% | |
| Washington | Sorrell | 71.3% | |
| Carver | 25.9% | |
| Other | 2.8% | |
| Windham | Sorrell | 69.2% | |
| Carver | 25.0% | |
| Other | 5.7% | |
| Windsor | Sorrell | 65.8% | |
| Carver | 30.6% | |
| Other | 3.7% | |