2006 Senatorial General Election Data Graphs - Wyoming
Note: The Google advertisement links below may advocate political positions that this site does not endorse.
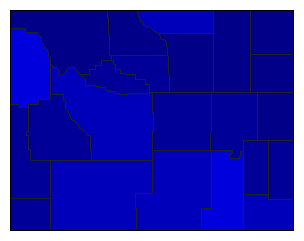
Map

AlbanyGroutage40.9%
 
Thomas58.6%
 
0.0%
 
Other0.4%


Big HornGroutage18.3%
 
Thomas81.6%
 
0.0%
 
Other0.2%


CampbellGroutage19.6%
 
Thomas80.4%
 
0.0%
 
Other0.0%


CarbonGroutage33.0%
 
Thomas66.9%
 
0.0%
 
Other0.1%


ConverseGroutage21.6%
 
Thomas78.3%
 
0.0%
 
Other0.1%


CrookGroutage18.1%
 
Thomas81.8%
 
0.0%
 
Other0.1%


FremontGroutage34.9%
 
Thomas64.9%
 
0.0%
 
Other0.2%


GoshenGroutage22.7%
 
Thomas77.2%
 
0.0%
 
Other0.0%


Hot SpringsGroutage26.2%
 
Thomas73.6%
 
0.0%
 
Other0.2%


JohnsonGroutage18.4%
 
Thomas81.5%
 
0.0%
 
Other0.1%


LaramieGroutage34.2%
 
Thomas65.6%
 
0.0%
 
Other0.1%


LincolnGroutage25.4%
 
Thomas74.5%
 
0.0%
 
Other0.1%


NatronaGroutage29.8%
 
Thomas70.1%
 
0.0%
 
Other0.2%


NiobraraGroutage17.0%
 
Thomas82.8%
 
0.0%
 
Other0.2%


ParkGroutage19.7%
 
Thomas80.1%
 
0.0%
 
Other0.2%


PlatteGroutage28.0%
 
Thomas72.0%
 
0.0%
 
Other0.1%


SheridanGroutage29.9%
 
Thomas69.9%
 
0.0%
 
Other0.2%


SubletteGroutage21.0%
 
Thomas79.0%
 
0.0%
 
Other0.1%


SweetwaterGroutage37.3%
 
Thomas62.7%
 
0.0%
 
Other0.1%


TetonGroutage43.8%
 
Thomas56.0%
 
0.0%
 
Other0.2%


UintaGroutage29.0%
 
Thomas70.9%
 
0.0%
 
Other0.1%


WashakieGroutage23.5%
 
Thomas76.2%
 
0.0%
 
Other0.2%


WestonGroutage19.1%
 
Thomas80.7%
 
0.0%
 
Other0.2%


National DataGraph for 2006 - Wyoming Results for 2006

Login

Terms of Use - DCMA Policy - Privacy Policy and Cookies


© Dave Leip's Atlas of U.S. Elections, LLC 2019 All Rights Reserved