2008 Presidential General Election Data Graphs - Massachusetts
by County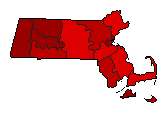
| Barnstable | Obama | 56.1% | |
| McCain | 42.1% | |
| Other | 1.8% | |
| Berkshire | Obama | 74.9% | |
| McCain | 22.5% | |
| Other | 2.6% | |
| Bristol | Obama | 60.4% | |
| McCain | 37.2% | |
| Other | 2.4% | |
| Dukes | Obama | 75.0% | |
| McCain | 23.1% | |
| Other | 1.9% | |
| Essex | Obama | 59.1% | |
| McCain | 38.8% | |
| Other | 2.1% | |
| Franklin | Obama | 72.5% | |
| McCain | 24.8% | |
| Other | 2.8% | |
| Hampden | Obama | 61.4% | |
| McCain | 36.1% | |
| Other | 2.5% | |
| Hampshire | Obama | 71.5% | |
| McCain | 25.9% | |
| Other | 2.6% | |
| Middlesex | Obama | 64.0% | |
| McCain | 33.9% | |
| Other | 2.2% | |
| Nantucket | Obama | 67.3% | |
| McCain | 30.8% | |
| Other | 1.9% | |
| Norfolk | Obama | 58.2% | |
| McCain | 39.7% | |
| Other | 2.1% | |
| Plymouth | Obama | 52.8% | |
| McCain | 45.2% | |
| Other | 2.0% | |
| Suffolk | Obama | 76.9% | |
| McCain | 21.2% | |
| Other | 1.8% | |
| Worcester | Obama | 55.6% | |
| McCain | 41.8% | |
| Other | 2.6% | |