2008 Presidential General Election Data Graphs - North Dakota
by County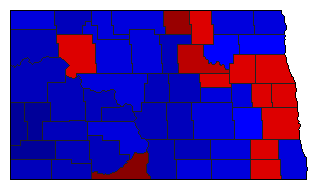
| Adams | Obama | 34.2% | |
| McCain | 62.0% | |
| Other | 3.8% | |
| Barnes | Obama | 48.1% | |
| McCain | 49.6% | |
| Other | 2.2% | |
| Benson | Obama | 66.1% | |
| McCain | 32.6% | |
| Other | 1.3% | |
| Billings | Obama | 22.8% | |
| McCain | 75.2% | |
| Other | 2.0% | |
| Bottineau | Obama | 39.4% | |
| McCain | 58.6% | |
| Other | 2.0% | |
| Bowman | Obama | 29.1% | |
| McCain | 67.5% | |
| Other | 3.4% | |
| Burke | Obama | 30.3% | |
| McCain | 67.9% | |
| Other | 1.8% | |
| Burleigh | Obama | 37.1% | |
| McCain | 60.6% | |
| Other | 2.3% | |
| Cass | Obama | 52.4% | |
| McCain | 45.3% | |
| Other | 2.3% | |
| Cavalier | Obama | 43.7% | |
| McCain | 53.0% | |
| Other | 3.4% | |
| Dickey | Obama | 39.8% | |
| McCain | 58.2% | |
| Other | 1.9% | |
| Divide | Obama | 41.0% | |
| McCain | 55.7% | |
| Other | 3.3% | |
| Dunn | Obama | 32.1% | |
| McCain | 65.7% | |
| Other | 2.3% | |
| Eddy | Obama | 50.0% | |
| McCain | 47.0% | |
| Other | 2.9% | |
| Emmons | Obama | 29.7% | |
| McCain | 67.0% | |
| Other | 3.3% | |
| Foster | Obama | 41.6% | |
| McCain | 55.4% | |
| Other | 3.0% | |
| Golden Valley | Obama | 24.0% | |
| McCain | 73.4% | |
| Other | 2.6% | |
| Grand Forks | Obama | 51.4% | |
| McCain | 46.3% | |
| Other | 2.3% | |
| Grant | Obama | 30.1% | |
| McCain | 64.9% | |
| Other | 5.0% | |
| Griggs | Obama | 45.5% | |
| McCain | 51.9% | |
| Other | 2.6% | |
| Hettinger | Obama | 30.1% | |
| McCain | 66.2% | |
| Other | 3.6% | |
| Kidder | Obama | 34.4% | |
| McCain | 61.2% | |
| Other | 4.4% | |
| LaMoure | Obama | 38.7% | |
| McCain | 58.5% | |
| Other | 2.8% | |
| Logan | Obama | 28.3% | |
| McCain | 68.7% | |
| Other | 3.0% | |
| McHenry | Obama | 40.6% | |
| McCain | 56.9% | |
| Other | 2.5% | |
| McIntosh | Obama | 37.8% | |
| McCain | 59.8% | |
| Other | 2.4% | |
| McKenzie | Obama | 34.4% | |
| McCain | 64.1% | |
| Other | 1.5% | |
| McLean | Obama | 39.4% | |
| McCain | 58.4% | |
| Other | 2.2% | |
| Mercer | Obama | 33.6% | |
| McCain | 63.4% | |
| Other | 3.0% | |
| Morton | Obama | 38.1% | |
| McCain | 59.0% | |
| Other | 2.9% | |
| Mountrail | Obama | 50.3% | |
| McCain | 47.9% | |
| Other | 1.9% | |
| Nelson | Obama | 51.8% | |
| McCain | 45.7% | |
| Other | 2.6% | |
| Oliver | Obama | 31.9% | |
| McCain | 65.6% | |
| Other | 2.5% | |
| Pembina | Obama | 45.2% | |
| McCain | 52.1% | |
| Other | 2.8% | |
| Pierce | Obama | 37.0% | |
| McCain | 60.8% | |
| Other | 2.2% | |
| Ramsey | Obama | 48.6% | |
| McCain | 49.6% | |
| Other | 1.8% | |
| Ransom | Obama | 56.4% | |
| McCain | 41.0% | |
| Other | 2.6% | |
| Renville | Obama | 37.5% | |
| McCain | 59.4% | |
| Other | 3.1% | |
| Richland | Obama | 46.4% | |
| McCain | 51.6% | |
| Other | 2.0% | |
| Rolette | Obama | 75.1% | |
| McCain | 23.0% | |
| Other | 1.9% | |
| Sargent | Obama | 57.9% | |
| McCain | 40.4% | |
| Other | 1.8% | |
| Sheridan | Obama | 28.5% | |
| McCain | 69.1% | |
| Other | 2.4% | |
| Sioux | Obama | 83.1% | |
| McCain | 15.6% | |
| Other | 1.3% | |
| Slope | Obama | 25.8% | |
| McCain | 72.3% | |
| Other | 1.9% | |
| Stark | Obama | 34.2% | |
| McCain | 63.1% | |
| Other | 2.7% | |
| Steele | Obama | 59.5% | |
| McCain | 39.1% | |
| Other | 1.4% | |
| Stutsman | Obama | 41.5% | |
| McCain | 56.2% | |
| Other | 2.3% | |
| Towner | Obama | 51.9% | |
| McCain | 44.8% | |
| Other | 3.3% | |
| Traill | Obama | 52.9% | |
| McCain | 45.7% | |
| Other | 1.5% | |
| Walsh | Obama | 47.6% | |
| McCain | 49.5% | |
| Other | 2.9% | |
| Ward | Obama | 39.4% | |
| McCain | 58.4% | |
| Other | 2.2% | |
| Wells | Obama | 35.4% | |
| McCain | 61.8% | |
| Other | 2.9% | |
| Williams | Obama | 31.2% | |
| McCain | 67.1% | |
| Other | 1.7% | |