2008 Secretary of State General Election Data Graphs - Vermont
by CountyData for this Contest was Contributed by on 2013-09-17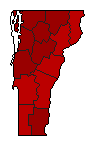
| Addison | Markowitz | 73.3% | |
| Bifano | 22.1% | |
| Other | 4.6% | |
| Bennington | Markowitz | 67.3% | |
| Bifano | 26.8% | |
| Other | 6.0% | |
| Caledonia | Markowitz | 65.5% | |
| Bifano | 28.3% | |
| Other | 6.1% | |
| Chittenden | Markowitz | 73.5% | |
| Bifano | 20.7% | |
| Other | 5.8% | |
| Essex | Markowitz | 60.2% | |
| Bifano | 31.7% | |
| Other | 8.1% | |
| Franklin | Markowitz | 70.4% | |
| Bifano | 24.5% | |
| Other | 5.1% | |
| Grand Isle | Markowitz | 71.3% | |
| Bifano | 24.5% | |
| Other | 4.2% | |
| Lamoille | Markowitz | 73.1% | |
| Bifano | 21.0% | |
| Other | 5.9% | |
| Orange | Markowitz | 67.9% | |
| Bifano | 25.1% | |
| Other | 7.0% | |
| Orleans | Markowitz | 70.2% | |
| Bifano | 23.6% | |
| Other | 6.2% | |
| Rutland | Markowitz | 67.0% | |
| Bifano | 27.8% | |
| Other | 5.2% | |
| Washington | Markowitz | 73.1% | |
| Bifano | 20.6% | |
| Other | 6.3% | |
| Windham | Markowitz | 72.5% | |
| Bifano | 20.3% | |
| Other | 7.2% | |
| Windsor | Markowitz | 69.7% | |
| Bifano | 24.2% | |
| Other | 6.2% | |