2008 Senatorial General Election Data Graphs - Wyoming
Note: The Google advertisement links below may advocate political positions that this site does not endorse.
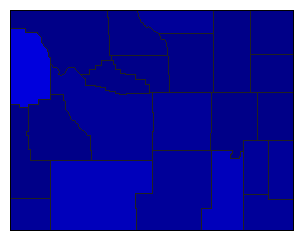
Map

AlbanyRothfuss37.0%
 
Enzi62.9%
 
0.0%
 
Other0.1%


Big HornRothfuss12.9%
 
Enzi87.0%
 
0.0%
 
Other0.1%


CampbellRothfuss12.0%
 
Enzi87.9%
 
0.0%
 
Other0.1%


CarbonRothfuss26.2%
 
Enzi73.7%
 
0.0%
 
Other0.1%


ConverseRothfuss15.5%
 
Enzi84.5%
 
0.0%
 
Other0.0%


CrookRothfuss12.0%
 
Enzi87.8%
 
0.0%
 
Other0.2%


FremontRothfuss24.6%
 
Enzi75.4%
 
0.0%
 
Other0.1%


GoshenRothfuss20.8%
 
Enzi79.2%
 
0.0%
 
Other0.0%


Hot SpringsRothfuss16.8%
 
Enzi83.1%
 
0.0%
 
Other0.1%


JohnsonRothfuss13.4%
 
Enzi86.4%
 
0.0%
 
Other0.2%


LaramieRothfuss29.1%
 
Enzi70.8%
 
0.0%
 
Other0.1%


LincolnRothfuss16.9%
 
Enzi82.9%
 
0.0%
 
Other0.1%


NatronaRothfuss24.1%
 
Enzi75.8%
 
0.0%
 
Other0.1%


NiobraraRothfuss13.8%
 
Enzi86.2%
 
0.0%


ParkRothfuss17.9%
 
Enzi82.0%
 
0.0%
 
Other0.1%


PlatteRothfuss24.4%
 
Enzi75.6%
 
0.0%
 
Other0.0%


SheridanRothfuss21.0%
 
Enzi79.0%
 
0.0%
 
Other0.0%


SubletteRothfuss16.0%
 
Enzi83.8%
 
0.0%
 
Other0.2%


SweetwaterRothfuss30.0%
 
Enzi69.8%
 
0.0%
 
Other0.1%


TetonRothfuss46.0%
 
Enzi53.8%
 
0.0%
 
Other0.2%


UintaRothfuss23.5%
 
Enzi76.4%
 
0.0%
 
Other0.1%


WashakieRothfuss14.9%
 
Enzi85.0%
 
0.0%
 
Other0.1%


WestonRothfuss14.7%
 
Enzi85.2%
 
0.0%
 
Other0.1%


National DataGraph for 2008 - Wyoming Results for 2008

Login

Terms of Use - DCMA Policy - Privacy Policy and Cookies


© Dave Leip's Atlas of U.S. Elections, LLC 2019 All Rights Reserved