2010 Comptroller General General Election Data Graphs - Illinois
Note: The Google advertisement links below may advocate political positions that this site does not endorse.
Data for this Contest was Contributed by on 2010-12-11
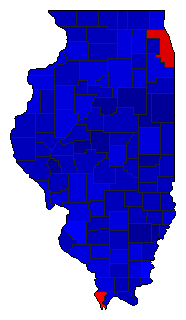
Map

AdamsMiller25.2%
 
Topinka68.6%
 
Other6.2%


AlexanderMiller49.7%
 
Topinka44.8%
 
Other5.6%


BondMiller34.2%
 
Topinka59.4%
 
Other6.4%


BooneMiller26.4%
 
Topinka63.8%
 
Other9.8%


BrownMiller27.1%
 
Topinka66.3%
 
Other6.6%


BureauMiller32.6%
 
Topinka59.5%
 
Other7.9%


CalhounMiller41.5%
 
Topinka53.2%
 
Other5.3%


CarrollMiller26.4%
 
Topinka65.8%
 
Other7.9%


CassMiller31.6%
 
Topinka61.5%
 
Other6.9%


ChampaignMiller33.4%
 
Topinka58.4%
 
Other8.3%


ChristianMiller30.9%
 
Topinka61.0%
 
Other8.0%


ClarkMiller30.4%
 
Topinka64.3%
 
Other5.3%


ClayMiller27.9%
 
Topinka66.3%
 
Other5.8%


ClintonMiller27.6%
 
Topinka66.8%
 
Other5.7%


ColesMiller28.3%
 
Topinka64.9%
 
Other6.8%


CookMiller55.1%
 
Topinka39.8%
 
Other5.1%


CrawfordMiller26.8%
 
Topinka67.1%
 
Other6.1%


CumberlandMiller26.8%
 
Topinka66.0%
 
Other7.2%


DeKalbMiller32.2%
 
Topinka57.7%
 
Other10.1%


De WittMiller25.1%
 
Topinka65.5%
 
Other9.4%


DouglasMiller22.2%
 
Topinka71.4%
 
Other6.4%


DuPageMiller29.7%
 
Topinka64.2%
 
Other6.0%


EdgarMiller28.4%
 
Topinka66.1%
 
Other5.4%


EdwardsMiller18.6%
 
Topinka76.1%
 
Other5.3%


EffinghamMiller22.6%
 
Topinka69.2%
 
Other8.2%


FayetteMiller27.8%
 
Topinka65.6%
 
Other6.7%


FordMiller18.5%
 
Topinka72.4%
 
Other9.1%


FranklinMiller41.4%
 
Topinka50.9%
 
Other7.6%


FultonMiller40.4%
 
Topinka51.9%
 
Other7.7%


GallatinMiller45.6%
 
Topinka46.8%
 
Other7.6%


GreeneMiller28.7%
 
Topinka62.5%
 
Other8.7%


GrundyMiller32.9%
 
Topinka58.4%
 
Other8.6%


HamiltonMiller38.8%
 
Topinka53.9%
 
Other7.3%


HancockMiller28.6%
 
Topinka64.2%
 
Other7.2%


HardinMiller35.8%
 
Topinka58.3%
 
Other5.9%


HendersonMiller42.6%
 
Topinka51.0%
 
Other6.4%


HenryMiller32.3%
 
Topinka61.2%
 
Other6.5%


IroquoisMiller18.7%
 
Topinka73.0%
 
Other8.4%


JacksonMiller39.6%
 
Topinka50.5%
 
Other9.8%


JasperMiller30.7%
 
Topinka64.5%
 
Other4.8%


JeffersonMiller32.7%
 
Topinka60.1%
 
Other7.2%


JerseyMiller33.0%
 
Topinka59.4%
 
Other7.6%


Jo DaviessMiller31.0%
 
Topinka61.5%
 
Other7.5%


JohnsonMiller24.2%
 
Topinka67.2%
 
Other8.6%


KaneMiller31.4%
 
Topinka59.8%
 
Other8.9%


KankakeeMiller31.9%
 
Topinka60.4%
 
Other7.7%


KendallMiller29.8%
 
Topinka60.7%
 
Other9.4%


KnoxMiller36.7%
 
Topinka56.6%
 
Other6.6%


LakeMiller34.1%
 
Topinka58.8%
 
Other7.0%


LaSalleMiller33.7%
 
Topinka58.1%
 
Other8.2%


LawrenceMiller33.8%
 
Topinka59.7%
 
Other6.5%


LeeMiller27.7%
 
Topinka64.8%
 
Other7.5%


LivingstonMiller22.3%
 
Topinka70.1%
 
Other7.6%


LoganMiller19.6%
 
Topinka72.2%
 
Other8.2%


McDonoughMiller31.2%
 
Topinka61.8%
 
Other7.0%


McHenryMiller27.7%
 
Topinka62.0%
 
Other10.3%


McLeanMiller29.5%
 
Topinka61.4%
 
Other9.1%


MaconMiller36.5%
 
Topinka56.9%
 
Other6.5%


MacoupinMiller36.2%
 
Topinka56.5%
 
Other7.3%


MadisonMiller39.1%
 
Topinka54.3%
 
Other6.7%


MarionMiller34.1%
 
Topinka59.2%
 
Other6.7%


MarshallMiller25.2%
 
Topinka65.2%
 
Other9.6%


MasonMiller32.4%
 
Topinka60.1%
 
Other7.5%


MassacMiller30.9%
 
Topinka63.2%
 
Other5.9%


MenardMiller18.3%
 
Topinka74.9%
 
Other6.8%


MercerMiller36.0%
 
Topinka56.8%
 
Other7.2%


MonroeMiller30.2%
 
Topinka64.8%
 
Other5.1%


MontgomeryMiller32.6%
 
Topinka59.7%
 
Other7.7%


MorganMiller25.6%
 
Topinka67.0%
 
Other7.4%


MoultrieMiller30.0%
 
Topinka62.2%
 
Other7.8%


OgleMiller23.0%
 
Topinka67.1%
 
Other9.9%


PeoriaMiller35.8%
 
Topinka56.8%
 
Other7.4%


PerryMiller37.9%
 
Topinka54.1%
 
Other8.0%


PiattMiller23.0%
 
Topinka68.9%
 
Other8.1%


PikeMiller29.9%
 
Topinka62.3%
 
Other7.8%


PopeMiller28.2%
 
Topinka64.3%
 
Other7.5%


PulaskiMiller42.4%
 
Topinka52.4%
 
Other5.2%


PutnamMiller37.7%
 
Topinka55.8%
 
Other6.5%


RandolphMiller39.5%
 
Topinka53.6%
 
Other6.9%


RichlandMiller25.1%
 
Topinka69.6%
 
Other5.2%


Rock IslandMiller43.8%
 
Topinka50.4%
 
Other5.8%


St. ClairMiller46.4%
 
Topinka48.3%
 
Other5.3%


SalineMiller35.2%
 
Topinka57.3%
 
Other7.5%


SangamonMiller24.8%
 
Topinka69.2%
 
Other6.0%


SchuylerMiller29.9%
 
Topinka62.4%
 
Other7.8%


ScottMiller23.1%
 
Topinka70.6%
 
Other6.3%


ShelbyMiller28.6%
 
Topinka62.7%
 
Other8.7%


StarkMiller24.2%
 
Topinka66.5%
 
Other9.3%


StephensonMiller27.3%
 
Topinka63.1%
 
Other9.6%


TazewellMiller29.8%
 
Topinka62.8%
 
Other7.4%


UnionMiller36.2%
 
Topinka55.8%
 
Other8.0%


VermilionMiller32.7%
 
Topinka60.5%
 
Other6.8%


WabashMiller28.1%
 
Topinka67.6%
 
Other4.3%


WarrenMiller30.6%
 
Topinka62.8%
 
Other6.5%


WashingtonMiller25.3%
 
Topinka68.1%
 
Other6.6%


WayneMiller22.1%
 
Topinka73.9%
 
Other4.0%


WhiteMiller30.4%
 
Topinka64.4%
 
Other5.2%


WhitesideMiller38.4%
 
Topinka54.8%
 
Other6.8%


WillMiller35.9%
 
Topinka57.1%
 
Other6.9%


WilliamsonMiller30.3%
 
Topinka62.3%
 
Other7.4%


WinnebagoMiller31.2%
 
Topinka60.1%
 
Other8.7%


WoodfordMiller21.3%
 
Topinka70.5%
 
Other8.2%


National DataGraph for 2010 - Illinois Results for 2010

Login

Terms of Use - DCMA Policy - Privacy Policy and Cookies


© Dave Leip's Atlas of U.S. Elections, LLC 2019 All Rights Reserved