2010 Secretary of State General Election Data Graphs - Massachusetts
by CountyData for this Contest was Contributed by on 2016-09-27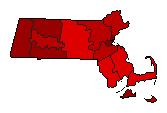
| Barnstable | Galvin | 59.7% | |
| Campbell | 38.2% | |
| Other | 2.1% | |
| Berkshire | Galvin | 73.1% | |
| Campbell | 23.5% | |
| Other | 3.4% | |
| Bristol | Galvin | 59.3% | |
| Campbell | 36.2% | |
| Other | 4.4% | |
| Dukes | Galvin | 74.0% | |
| Campbell | 23.5% | |
| Other | 2.4% | |
| Essex | Galvin | 61.6% | |
| Campbell | 36.1% | |
| Other | 2.4% | |
| Franklin | Galvin | 72.3% | |
| Campbell | 24.3% | |
| Other | 3.4% | |
| Hampden | Galvin | 70.2% | |
| Campbell | 26.9% | |
| Other | 2.9% | |
| Hampshire | Galvin | 62.0% | |
| Campbell | 34.7% | |
| Other | 3.3% | |
| Middlesex | Galvin | 66.7% | |
| Campbell | 30.6% | |
| Other | 2.7% | |
| Nantucket | Galvin | 62.7% | |
| Campbell | 35.3% | |
| Other | 2.1% | |
| Norfolk | Galvin | 65.9% | |
| Campbell | 31.7% | |
| Other | 2.4% | |
| Plymouth | Galvin | 58.6% | |
| Campbell | 38.8% | |
| Other | 2.5% | |
| Suffolk | Galvin | 80.8% | |
| Campbell | 16.8% | |
| Other | 2.4% | |
| Worcester | Galvin | 56.8% | |
| Campbell | 39.4% | |
| Other | 3.8% | |