2010 State Treasurer General Election Data Graphs - Massachusetts
by CountyData for this Contest was Contributed by on 2016-09-27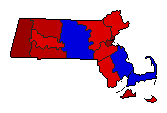
| Barnstable | Grossman | 48.4% | |
| Polito | 51.6% | |
| Other | 0.0% | |
| Berkshire | Grossman | 70.9% | |
| Polito | 29.1% | |
| Other | 0.0% | |
| Bristol | Grossman | 53.8% | |
| Polito | 46.1% | |
| Other | 0.1% | |
| Dukes | Grossman | 67.4% | |
| Polito | 32.5% | |
| Other | 0.1% | |
| Essex | Grossman | 51.5% | |
| Polito | 48.4% | |
| Other | 0.1% | |
| Franklin | Grossman | 67.7% | |
| Polito | 32.3% | |
| Other | 0.0% | |
| Hampden | Grossman | 64.0% | |
| Polito | 36.0% | |
| Other | 0.1% | |
| Hampshire | Grossman | 54.4% | |
| Polito | 45.5% | |
| Other | 0.1% | |
| Middlesex | Grossman | 58.5% | |
| Polito | 41.4% | |
| Other | 0.1% | |
| Nantucket | Grossman | 58.3% | |
| Polito | 41.5% | |
| Other | 0.1% | |
| Norfolk | Grossman | 55.2% | |
| Polito | 44.7% | |
| Other | 0.1% | |
| Plymouth | Grossman | 47.8% | |
| Polito | 52.2% | |
| Other | 0.1% | |
| Suffolk | Grossman | 73.3% | |
| Polito | 26.5% | |
| Other | 0.2% | |
| Worcester | Grossman | 40.3% | |
| Polito | 59.7% | |
| Other | 0.1% | |