2010 Attorney General General Election Data Graphs - New York
Note: The Google advertisement links below may advocate political positions that this site does not endorse.
Data for this Contest was Contributed by on 2011-05-18
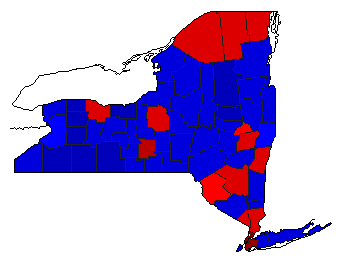
Map

AlbanySchneiderman57.3%
 
Donovan41.2%
 
Other1.5%


AlleganySchneiderman33.3%
 
Donovan65.4%
 
Other1.3%


BronxSchneiderman85.1%
 
Donovan13.0%
 
Other1.9%


BroomeSchneiderman48.2%
 
Donovan50.6%
 
Other1.2%


CattaraugusSchneiderman38.2%
 
Donovan60.5%
 
Other1.4%


CayugaSchneiderman47.2%
 
Donovan51.3%
 
Other1.5%


ChautauquaSchneiderman40.9%
 
Donovan57.7%
 
Other1.4%


ChemungSchneiderman40.9%
 
Donovan58.3%
 
Other0.9%


ChenangoSchneiderman41.8%
 
Donovan56.3%
 
Other1.9%


ClintonSchneiderman51.8%
 
Donovan47.2%
 
Other1.0%


ColumbiaSchneiderman50.4%
 
Donovan48.3%
 
Other1.3%


CortlandSchneiderman47.5%
 
Donovan51.0%
 
Other1.5%


DelawareSchneiderman40.4%
 
Donovan58.3%
 
Other1.2%


DutchessSchneiderman46.8%
 
Donovan52.1%
 
Other1.0%


ErieSchneiderman48.6%
 
Donovan50.0%
 
Other1.5%


EssexSchneiderman47.4%
 
Donovan51.3%
 
Other1.3%


FranklinSchneiderman51.8%
 
Donovan47.1%
 
Other1.1%


FultonSchneiderman37.4%
 
Donovan61.0%
 
Other1.6%


GeneseeSchneiderman34.6%
 
Donovan63.9%
 
Other1.6%


GreeneSchneiderman39.4%
 
Donovan59.1%
 
Other1.6%


HamiltonSchneiderman32.4%
 
Donovan65.7%
 
Other1.9%


HerkimerSchneiderman42.6%
 
Donovan56.0%
 
Other1.5%


JeffersonSchneiderman46.0%
 
Donovan53.0%
 
Other1.0%


KingsSchneiderman76.7%
 
Donovan21.6%
 
Other1.6%


LewisSchneiderman41.4%
 
Donovan57.5%
 
Other1.1%


LivingstonSchneiderman40.1%
 
Donovan58.5%
 
Other1.5%


MadisonSchneiderman44.1%
 
Donovan54.0%
 
Other1.9%


MonroeSchneiderman52.1%
 
Donovan46.7%
 
Other1.2%


MontgomerySchneiderman42.0%
 
Donovan55.7%
 
Other2.4%


NassauSchneiderman47.3%
 
Donovan52.0%
 
Other0.6%


New YorkSchneiderman80.2%
 
Donovan18.4%
 
Other1.4%


NiagaraSchneiderman41.5%
 
Donovan57.1%
 
Other1.4%


OneidaSchneiderman45.2%
 
Donovan53.5%
 
Other1.2%


OnondagaSchneiderman52.6%
 
Donovan45.8%
 
Other1.6%


OntarioSchneiderman43.7%
 
Donovan54.9%
 
Other1.4%


OrangeSchneiderman48.2%
 
Donovan50.9%
 
Other0.9%


OrleansSchneiderman34.7%
 
Donovan63.8%
 
Other1.6%


OswegoSchneiderman43.8%
 
Donovan53.9%
 
Other2.3%


OtsegoSchneiderman47.2%
 
Donovan51.3%
 
Other1.5%


PutnamSchneiderman41.4%
 
Donovan57.9%
 
Other0.7%


QueensSchneiderman71.4%
 
Donovan27.2%
 
Other1.4%


RensselaerSchneiderman48.4%
 
Donovan49.8%
 
Other1.8%


RichmondSchneiderman34.1%
 
Donovan65.1%
 
Other0.9%


RocklandSchneiderman53.1%
 
Donovan46.3%
 
Other0.6%


St. LawrenceSchneiderman53.9%
 
Donovan45.0%
 
Other1.1%


SaratogaSchneiderman43.6%
 
Donovan54.9%
 
Other1.5%


SchenectadySchneiderman49.3%
 
Donovan48.5%
 
Other2.2%


SchoharieSchneiderman38.9%
 
Donovan59.0%
 
Other2.1%


SchuylerSchneiderman40.6%
 
Donovan58.3%
 
Other1.1%


SenecaSchneiderman44.6%
 
Donovan53.9%
 
Other1.5%


SteubenSchneiderman36.2%
 
Donovan62.5%
 
Other1.2%


SuffolkSchneiderman45.5%
 
Donovan53.7%
 
Other0.8%


SullivanSchneiderman49.5%
 
Donovan49.2%
 
Other1.4%


TiogaSchneiderman38.9%
 
Donovan59.7%
 
Other1.4%


TompkinsSchneiderman66.6%
 
Donovan32.3%
 
Other1.1%


UlsterSchneiderman53.5%
 
Donovan45.3%
 
Other1.2%


WarrenSchneiderman41.1%
 
Donovan57.5%
 
Other1.4%


WashingtonSchneiderman42.3%
 
Donovan55.8%
 
Other1.8%


WayneSchneiderman38.4%
 
Donovan60.2%
 
Other1.4%


WestchesterSchneiderman55.8%
 
Donovan43.6%
 
Other0.6%


WyomingSchneiderman31.3%
 
Donovan67.2%
 
Other1.6%


YatesSchneiderman40.7%
 
Donovan57.9%
 
Other1.4%


National DataGraph for 2010 - New York Results for 2010

Login

Terms of Use - DCMA Policy - Privacy Policy and Cookies


© Dave Leip's Atlas of U.S. Elections, LLC 2019 All Rights Reserved